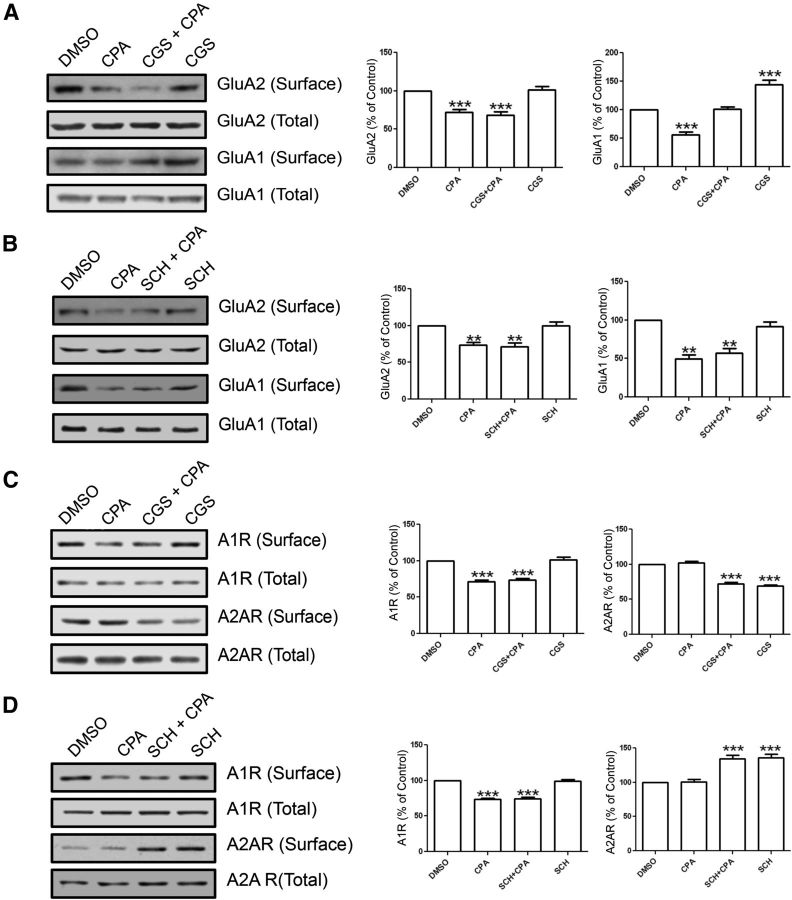
Figure 9.
The A2AR does not affect A1R-induced GluA2 internalization but does affect A1R-induced GluA1 internalization. A, Surface biotinylation of hippocampal slices that were preincubated with DMSO (control) or CGS 21680 (10 nm), an A2AR agonist, for 1 h followed by CPA treatment (500 nm, 45 min). Blots (left) were probed for GluA2 and GluA1 levels, and summary bar charts (right) show that CGS 21680 alone or in combination with CPA did not mimic or prevent the inhibitory effect of CPA on GluA2 surface expression (left bar chart). Conversely, CGS 21680 prevented CPA-induced GluA1 internalization, and CGS 21680 by itself significantly increased GluA1 surface levels without CPA treatment (right bar chart). B, Biotinylation of hippocampal slices preincubated in SCH 58261 (30 nm), an A2AR antagonist followed by CPA treatment (500 nm, 45 min). Summary bar charts show that SCH 58261 did not significantly affect CPA's effect on the surface levels of GluA2 and GluA1. C, Hippocampal biotinylation using the same protocol as in A labeled for A1R and A2AR. Summary bar chart for A1R (left chart) shows that CPA and CGS 21680 with CPA induced a reduction in surface A1Rs and were not affected by CGS 21680 by itself. The A2AR surface levels (right chart) were not affected by CPA treatment alone but were reduced with CGS 21680 treatments. D, Using the same drug treatments as in B, biotinylation shows A1R and A2AR expression levels with CPA, SCH 58261, or CPA and SCH 58261 together. Summary bar chart for A1R (left chart) shows that CPA alone and CPA with SCH 58261 induced reduced surface levels of A1R, but SCH 58261 alone did not affect A1R levels. A2AR surface levels (right chart) show that CPA and SCH 58261 together as well as SCH58261 by itself caused an increase in A2AR surface levels, but CPA alone did not affect surface levels. Values are mean ± SEM. **p < 0.01. ***p < 0.001.

