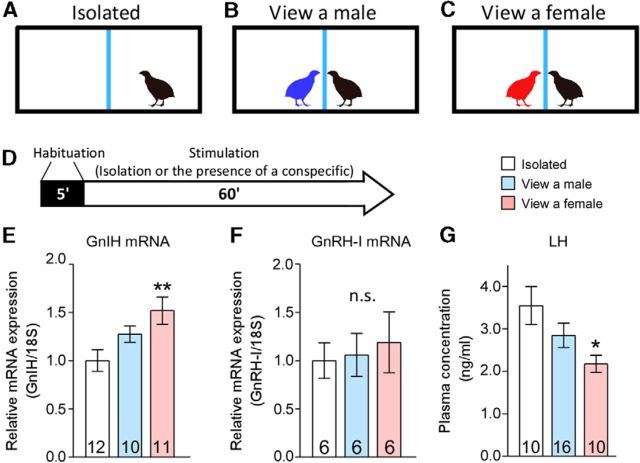
Figure 1.
Effects of male or female presence on GnIH and GnRH-I mRNA expressions and plasma LH concentration in males. A–C, The experimental cages were divided in the middle with a Plexiglas wall, indicated by the blue lines. D, Schematic representation of the experimental design depicting the habituation period (5 min, black bar) and the stimulation period (60 min, white arrow). E–G, Effects of the presence of a female on hypothalamic GnIH and GnRH-I gene expressions (E, F) and circulating LH level (G). Numbers in the bars denote the number of birds analyzed. One-way ANOVA followed by Tukey's multiple comparisons test, *p < 0.05, **p < 0.01 versus isolated group of birds. Data are presented as mean ± SEM.

