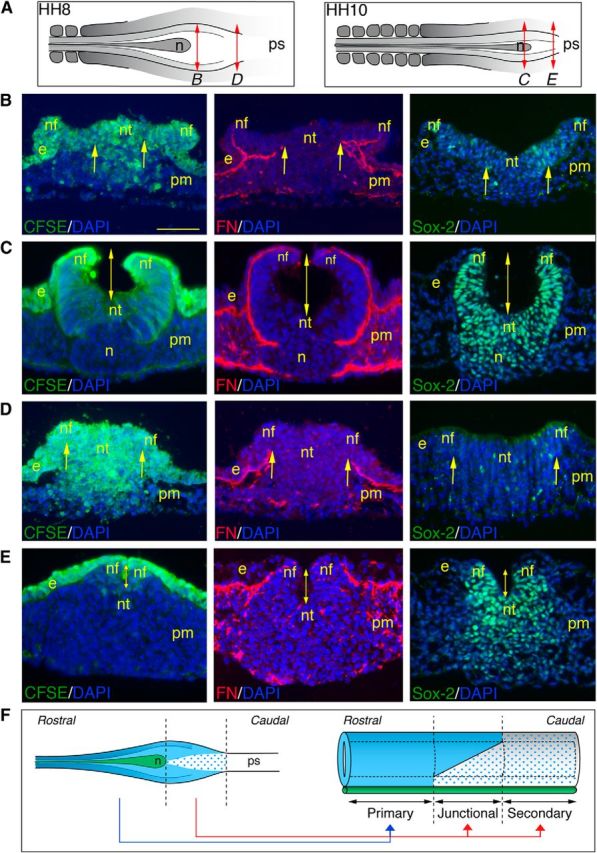
Figure 6.

Topological continuity between the primary and secondary neural tubes in the NSB. A, Schematic representations of the NSB at HH8 and HH10, indicating the approximate axial level of the sections shown in B–E. n, Hensen's node; ps, primitive streak. B–E, CFSE visualization (left panels) and immunostainings for fibronectin (middle panels) and Sox-2 (right panels), all combined with DAPI staining, on cross-sections through the rostral (B, C) and caudal (D, E) parts of the NSB. Embryos were labeled at HH8 (B, D) and HH10 (C, E) with CFSE for 1 h and further incubated for 3 h before analysis. Arrows indicate the portion of the neural plate where ingression occurs. In the rostral NSB (B), ingression is limited to the midline, whereas in its caudal end (D), it extends up to the neural folds. As a consequence of the greater proportion of cells undergoing movements of primary neurulation, the size of the lumen (indicated by a double-headed arrow) at HH10 is longer rostrally than caudally (C, E). e, Ectoderm; n, Hensen's node; nf, neural fold; nt, neural tissue; pm, paraxial mesoderm. Scale bar, 50 μm. F, Schematic representations of the NSB at HH8 (left panel) and the resulting spinal cord (right panel), reconstituting the different populations that constitute the NSB at HH8 and their ultimate contribution to the neural tube along the rostrocaudal axis. Light blue represents Sox-2-positive neural cells executing movements of primary neurulation; blue dots indicate Sox-2-negative neural progenitors undergoing EMT; green represents notochord. n, Hensen's node; ps, primitive streak.
