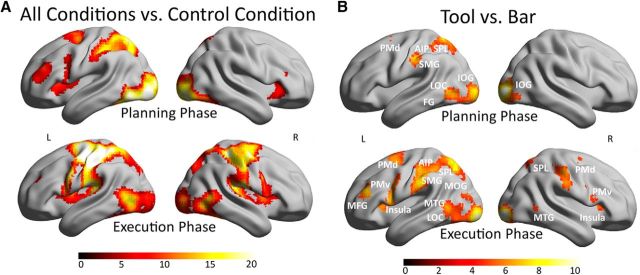
Figure 2.
Whole-brain results for the action network in A and the main contrast for the factor object in B. A, The activity maps of the contrast all conditions versus control condition shown for the planning phase in the top and for the execution phase on the bottom. B, The activity map of the contrast tool versus bar is shown for the planning phase in the top and for the execution phase in the bottom. All results of Figure 2 are shown at a threshold of p < 0.05 (FWE corrected) on a rendered brain. The color scale under the brain images indicates the range of the T values from low values in dark red to high values in white. IOG, Inferior occipital gyrus; MOG, middle occipital gyrus.

