
Figure 4.
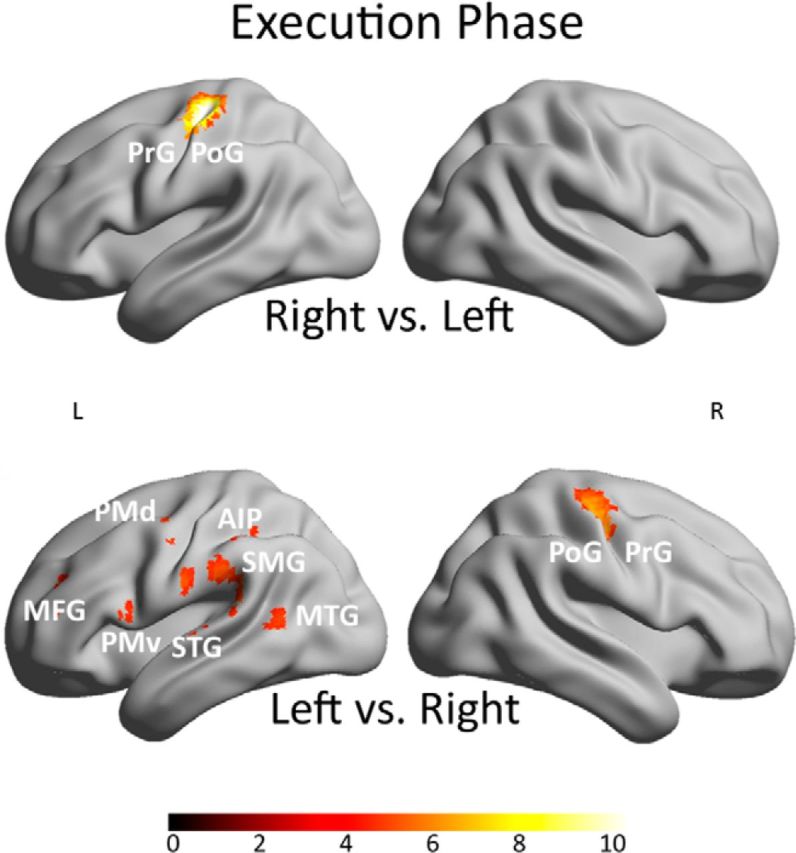
Results showing the influence of the factor hand on the action network. Activation maps of the contrast right hand versus left hand on the top and left hand versus right hand on the bottom for the execution phase. All results of Figure 4 are shown at a threshold of p < 0.05 (FWE corrected) on a rendered brain. The color scale under the brain images indicates the range of the T values from low values in dark red to high values in white. IOG, Inferior occipital gyrus; STG, superior temporal gyrus; PrG, precentral gyrus; PoG, postcentral gyrus.