Figure 3.
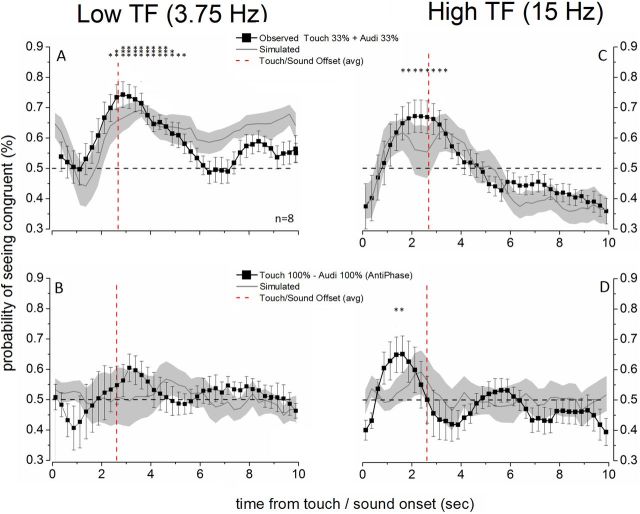
Auditory and tactile stimuli summate to bias binocular rivalry. The time course of the probability of seeing the visual stimulus congruent with the 3.75 Hz (left) or 15 Hz (right) cross-modal stimulus is plotted for the two trimodal experiments. Error bars indicate ±1 SEM. A, C, The weak auditory and tactile stimuli (33% modulation depth) presented simultaneously strongly biased binocular rivalry toward the visual modulation congruent with the audio-tactile temporal frequency. Each point on the probability trace was compared against chance level (dashed black line) using a one-sample t test (N = 8, df = 7). *p ≤ 0.05. **p ≤ 0.01. ***p ≤ 0.001. The gray traces simulate a linear summation of the individual auditory and tactile probability traces (Fig. 2, gray symbols) obtained by transforming the individual traces into d′ (Eq. 1) and then summing them and reverting the obtained compound d′ into probability again (Eq. 2). B, D, Combining strong auditory and tactile stimuli (100% modulation depth) did not bias binocular rivalry toward the congruent temporal frequency when the cross-modal stimuli were presented with opposite phases. The gray traces simulate a cancellation of the tactile and auditory effects (Fig. 2, black symbols) by transforming the individual auditory and tactile traces for into d′ (Eq. 1), subtracting them, and then reverting this difference into a probability again (Eq. 2). The vertical dashed red line represents the offset of cross-modal stimulation.

