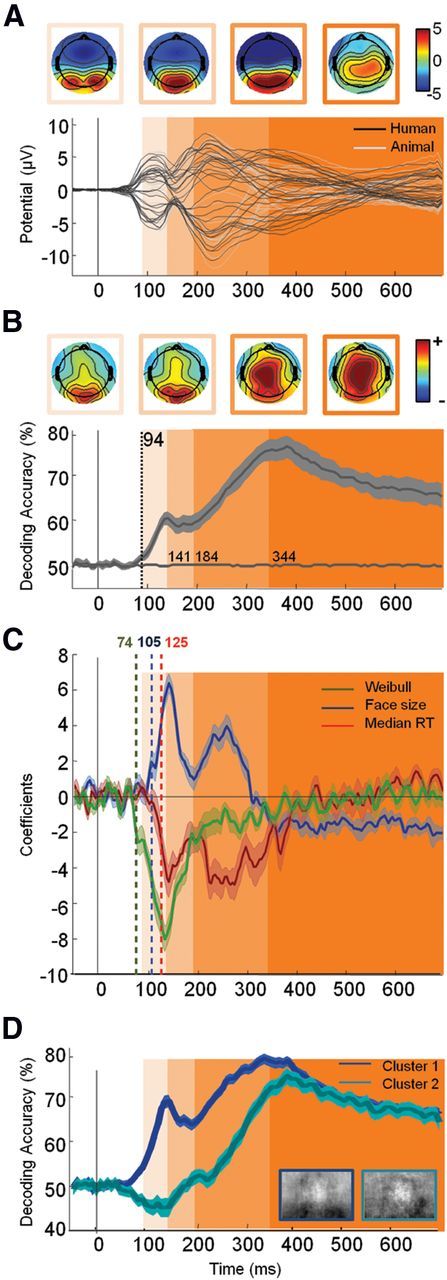
Figure 4.

Neural timing of face detection in natural scene. A, Top, Potential topographies (μv) averaged during the four periods defined in B using shaded areas. Bottom, Average ERP (n = 28) for each of the k = 32 electrodes for target (black) versus distractor (gray) stimuli. B, Top, Topographies of (normalized) decoding weights for face stimuli averaged during the four periods defined below by shaded areas. Bottom, Average temporal decoding accuracy (±95% CI) across all participants. The decoding accuracy estimated from permuted labels was used to assess chance level (shown in gray on the x-axis). The vertical dotted line indicates the latency of the first significant decoded bin (estimated using an aired permutation t test based on tmax method, p < 0.05). Based on the latency of this first bin and changes in the sign of the derivative of the temporal decoding curve, we isolated four distinct temporal widows (shown in shades of orange: 94–141 ms; 141–184 ms; 184–344 ms; >344 ms). These four windows are also shown on A and C for improved readability. C, Coefficient derived from the regression analysis on single image decoding (see Materials and Methods) with Weibull α (green), face size (blue), and subject median RTs (red) (±95% bootstrapped CIs). Latency of significance (corrected for multiple comparison using FDR, p < 0.01) is indicated by a vertical dotted bar of the corresponding color. The y-axis corresponds to the change in accuracy for one SD change of the considered variable. D, Temporal decoding (±95% CI) of the two clusters computed using the k-means algorithm on the entire temporal decoding curve computed for individual images.
