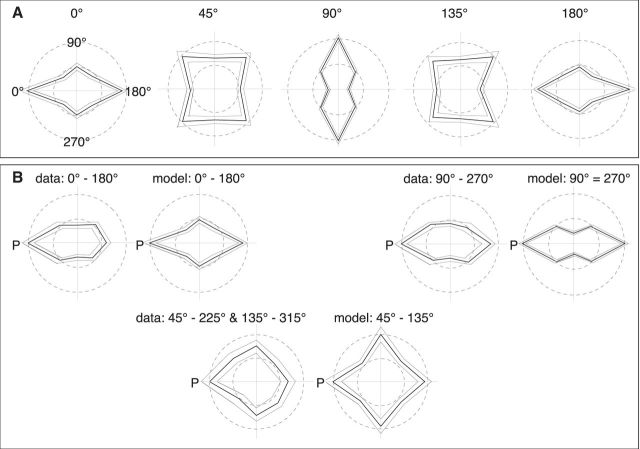
Figure 4.
A, Polar plots of average tuning curves for facing direction for each of the five facing representations (0°, 45°, 90°, 135°, and 180°). The thick lines indicate the mean; the thin lines indicate the SEM. The outer circles represent maximal response; the inner circles represent 50% of that. B, Comparison of the tuning curves of the posture-selective neurons of the model to the tuning curves of the facing direction-selective neurons found in STS (Vangeneugden et al., 2011) for the stimuli grouping used in that study.

