Figure 2.
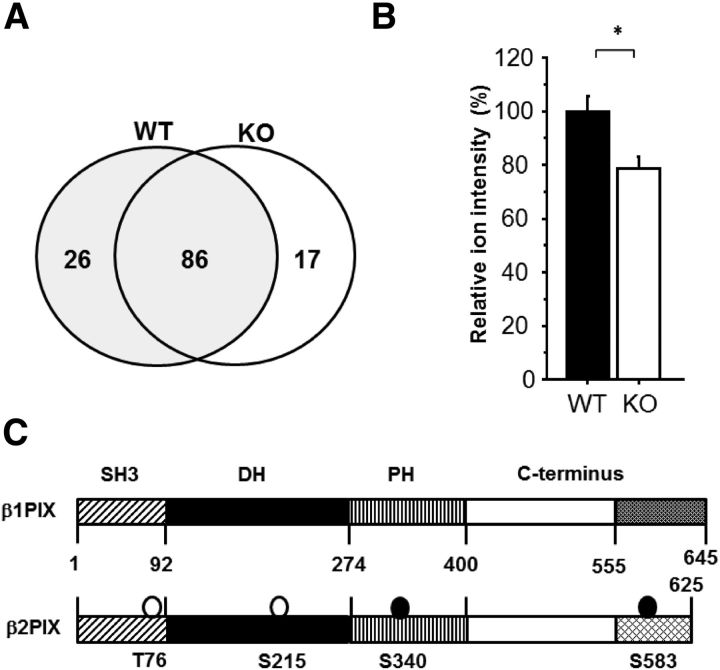
Phosphoproteome analysis revealed 10 phosphopeptides with decreased average ion intensity in PKCγ KO mice striatum. A, Overview of the phosphoproteome (WT, n = 5; KO, n = 4). B, Average ion intensity of the Ser340 βPIX phosphopeptide is calculated in both PKCγ KO and WT mice (n = 4–5; *p < 0.05, unpaired t test). The relative average ion intensity of WT mice was defined as 100%. The results are expressed as mean ± SEM. C, Schematic illustrations of the β1 and β2 PIX protein. The phosphorylation sites that were determined by the in vitro PKC phosphorylation assay and the phosphoproteome analysis are circled. The open circles are the phosphorylation sites that were determined only in vitro. The closed circles are the phosphorylation sites that were determined in vitro and in vivo.

