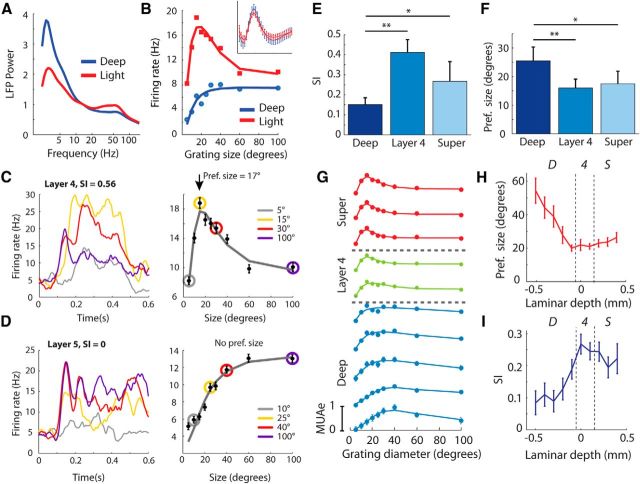
Figure 3.
Size tuning in the different layers of V1. A, We judged the depth of anesthesia using the LFP as the relative contribution of low-frequency power (2–8 Hz) to the power spectrum of the LFP. The average power across layers is shown at two different time points (2 h apart) of a single penetration. B, Size-tuning curves from a single neuron in layer 4 recorded under both deep and light anesthesia. The inset shows the average spike waveform of the cell under the two states of anesthesia. C, An example single unit from layer 4 (the same cell as in A). The left plot shows the PSTH for four of the grating sizes. The right plot shows the size-tuning curve; the sizes shown on the left are indicated with colored circles. D, An example unit in the deep layers without surround suppression. E, Median SI across different layers. Significant differences between compartments as judged by Wilcoxon signed-rank tests are indicated by the asterisks (*p < 0.05, **p < 0.01). Error bars show bootstrap estimates of SEM. F, The median preferred size as assessed by the size-tuning curves across the population of single units for the different layers. G, MUAe size-tuning curves recorded simultaneously from different layers of a single penetration. Surround suppression was strongest in layer 4 and the superficial layers. H, The median MUAe RF size in different layers across the population of 200 recording sites. I, The median SI revealed stronger suppression in layer 4 and the superficial layers than in the deep layers. Error bars are bootstrap estimates of SEM.

