Figure 3.
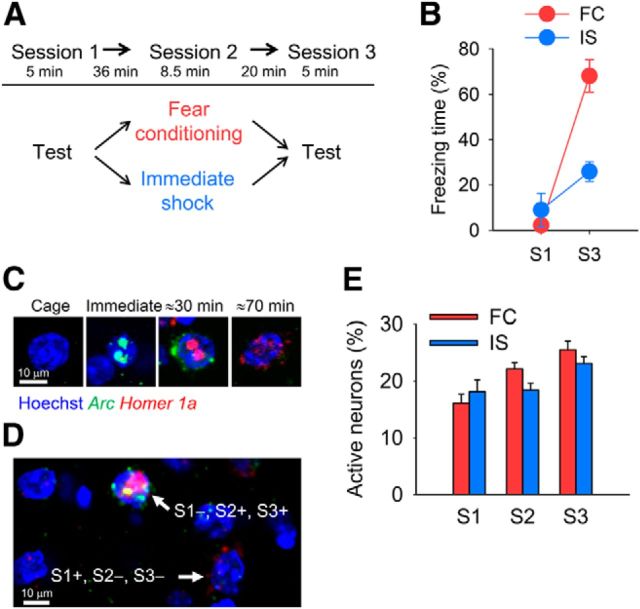
Large-scale activity imaging before, during, and after fear conditioning in the BLA. A, Experimental procedure (n = 8 mice per group). B, The FC but not the IS group exhibited contextual conditioned fear in session 3 (repeated-measures ANOVA, F(1,14) = 23.8, p = 0.00025; FC vs IS in session 3, p = 0.00017). C, Representative images of individual BLA neurons from fluorescent in situ hybridization of Arc and Homer 1a. D, A representative image of Arc and Homer 1a RNA expression from the FC group. A neuron with nuclear and cytoplasmic Arc and nuclear Homer 1a was activated in sessions 2 and 3 (S1−, S2+, S3+). A neuron with only cytoplasmic Homer 1a was activated in session 1 (S1+, S2−, S3−). E, Percentage of BLA neurons active in each session was comparable between the FC and IS groups (n = 319.0 ± 18.1 neurons in FC group and 313.3 ± 17.6 neurons in IS group per mouse).

