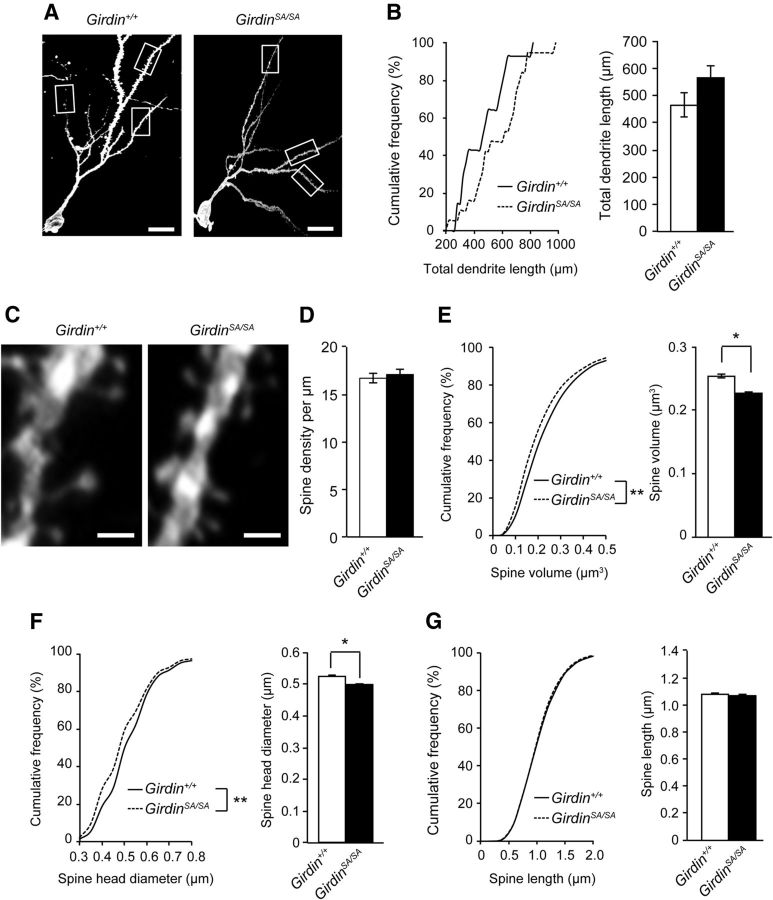
Figure 2.
Phosphorylation of Girdin S1416 regulates spine morphology in DGCs of mice. A, Representative image of DGCs in 8- to 12-week-old Girdin+/+ and GirdinSA/SA mice. Scale bar, 20 μm. B, Cumulative frequency and mean value of total dendrite length of Girdin+/+ and GirdinSA/SA mice. Data are expressed as mean ± SEM (n = 14–18 neurons from 3–4 mice). C, Representative images of the spines of DGCs in 8- to 12-week-old Girdin+/+ and GirdinSA/SA mice. Scale bar, 1 μm. D, Quantitative analysis of spine density. E–G, Cumulative frequency and mean value of spine volume (E), spine head diameter (F), and spine length (G) of DGCs in Girdin+/+ and GirdinSA/SA mice. Data are expressed as mean ± SEM (n = 3386–5536 spines from 3–4 mice). *p < 0.05 (Student's t test) and **p < 0.01 (Kolmogorov–Smirnov test) compared with Girdin+/+ mice.

