
Figure 1.
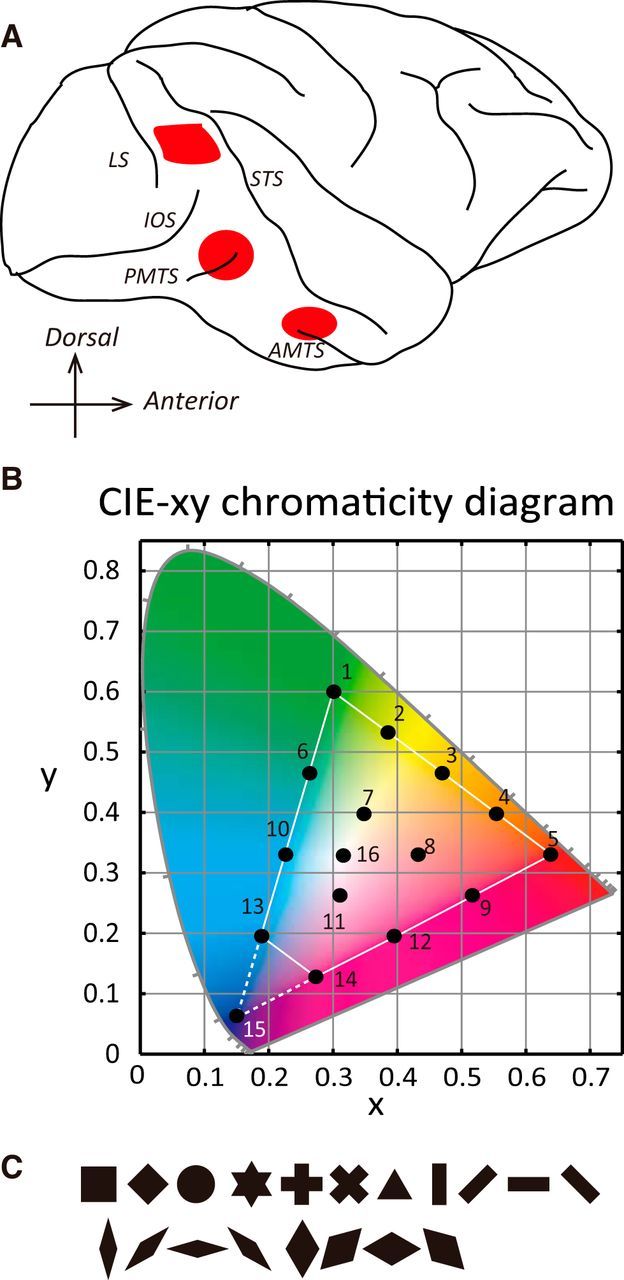
Recording sites and color stimuli. A, Approximate recording sites (red marks) in a lateral view of the right hemisphere of a monkey (top, V4; middle, PITC; bottom, AITC). B, Chromaticity coordinates of the stimuli in the color stimulus set plotted on the CIE-xy chromaticity diagram. Each color stimulus set contained 16 colors, including 15 chromatic colors whose chromaticity coordinates were evenly distributed on the chromaticity diagram (colors 1–15) and one achromatic color whose chromaticity coordinate was equal to the gray background (color 16). Fifteen stimuli (all except color 15) were presented at two different luminances (bright set, 20 cd/m2; dark set, 5cd/m2). Because the luminance of blue (color 15) in the bright set was different from the other colors, we omitted responses to that color elicited in both the bright and dark sets from the quantitative analysis. The white triangle indicates the gamut of displayed colors used for the experiments. C, Nineteen geometric shapes used to test the shape selectivity (V4, 19 or 11 shapes; PITC and AITC, 11 or 7 shapes). These shapes include, from top left to bottom right, square, oblique square, circle, star, cross, oblique cross, triangle, vertical bar, oblique bar in the clockwise direction, horizontal bar, oblique bar in the counterclockwise direction, narrow diamonds and broad diamonds (vertical diamond, oblique diamond in the clockwise direction, horizontal diamond and oblique diamond in the counterclockwise direction, respectively). Each of these shape stimuli was painted uniformly with a single color. LS, Lunate sulcus; IOS, inferior occipital sulcus.