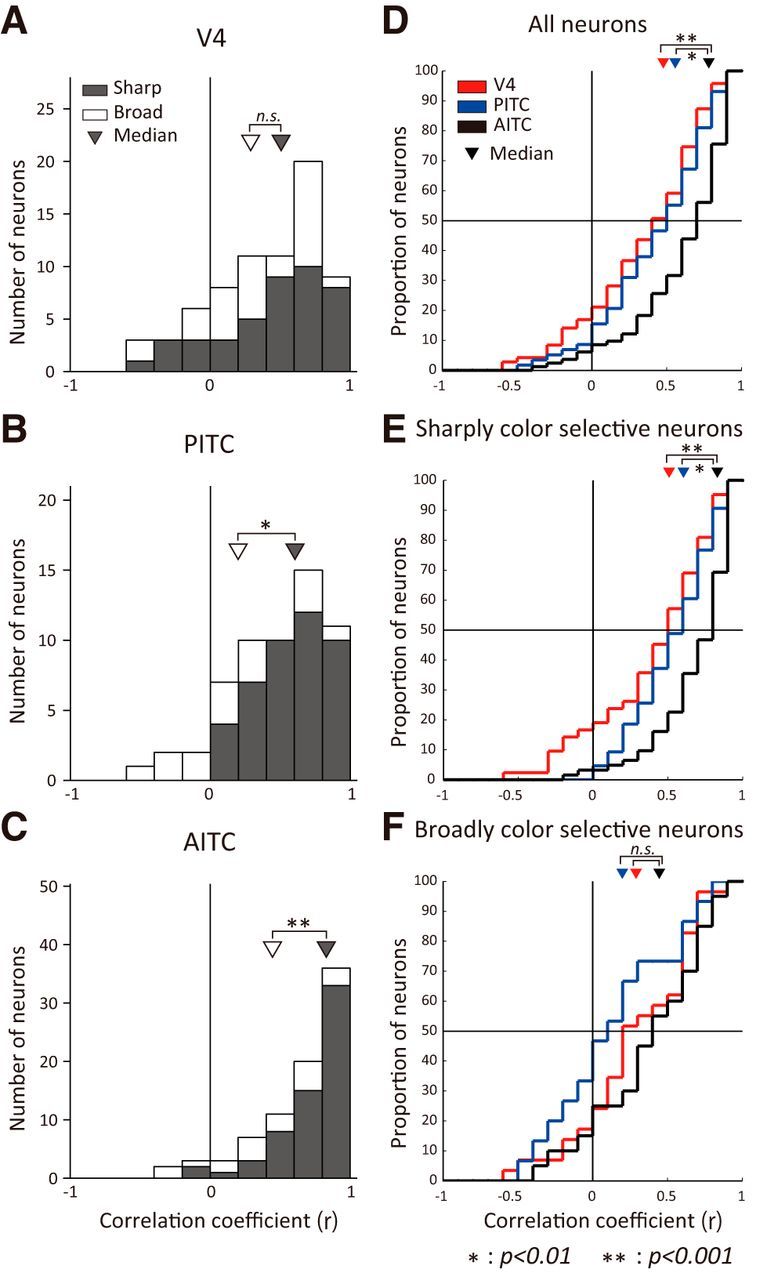
Figure 5.

Distribution of the correlation coefficients between responses to the bright and dark sets. A–C, Bar graphs show the distribution of correlation coefficients between responses to the bright and dark sets for V4 (A), PITC (B), and AITC (C) neurons. Solid bars represent neurons classified as sharply color-selective and open bars represent neurons classified as broadly color-selective (see Materials and Methods). Triangles indicate the medians of the distributions. D–F, Shown are cumulative histograms of the correlation coefficients between responses to the bright and dark sets for all neurons (D), sharply color-selective neurons (E), and broadly color-selective neurons (F). Red, blue, and black lines represent V4, PITC, and AITC neurons, respectively. Triangles indicate the medians; **p < 0.001; *p < 0.01; ns, not significant (Mann–Whitney U test).
