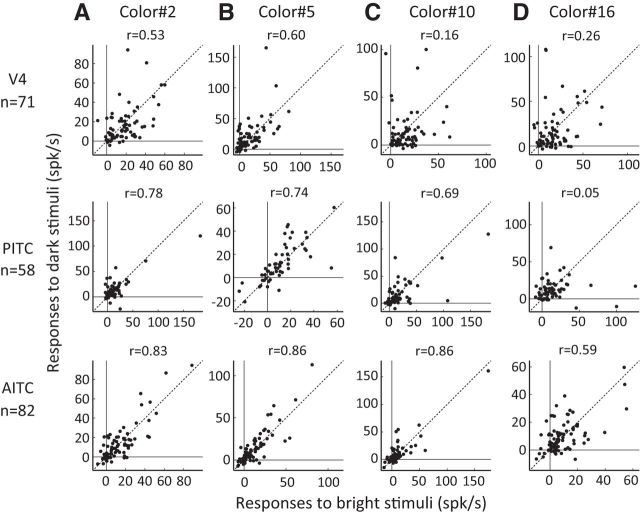
Figure 6.
Relationships between the population responses to a color stimulus in the bright set and the same color stimulus in the dark set for four example colors. The rows show the results in V4 (top), PITC (middle), and AITC (bottom). A, Scatter plots show the relationships between the population responses of color-selective neurons in each area to color 2 in the bright set (horizontal axis) and in the dark set (vertical axis). Each dot corresponds to one neuron. Diagonal lines connect the points where the responses to the stimuli in the bright and dark sets were identical. The correlation coefficient between the population responses is shown above each plot. B–D, Relationships between the population responses to color 5 (B), color 10 (C), and color 16 (D). The formats are the same as in A.

