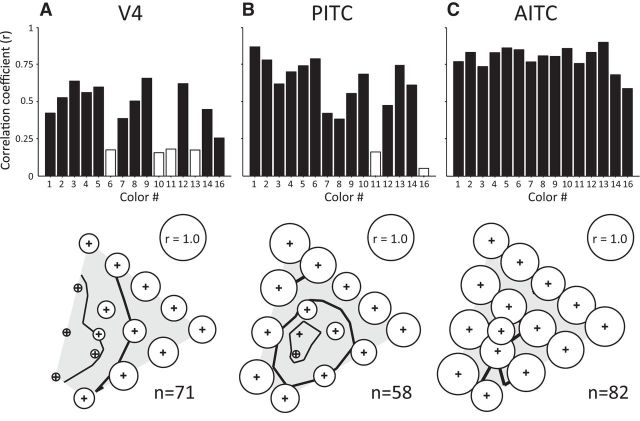
Figure 7.
Correlation coefficients between the population responses to each bright stimulus and the corresponding dark stimulus for the 15 colors in the stimulus set. A–C, Top row, The height of each bar shows the correlation coefficient between the population responses to each of the 15 colors in the bright set and those to the same color in the dark set. The color ID is shown below each bar. Solid and open bars indicate significant and nonsignificant correlations, respectively. In the bottom row, the correlation coefficients are indicated by the diameters of the circles plotted at the positions corresponding to the chromaticity coordinates of each color (bubble plot). For scale, circles with diameters corresponding to r = 1.0 are shown as insets. Contour lines of decreasing thickness indicate where the correlation coefficients are 0.75, 0.50, and 0.25, respectively. The numbers of neurons included in the sample are shown at the bottom.

