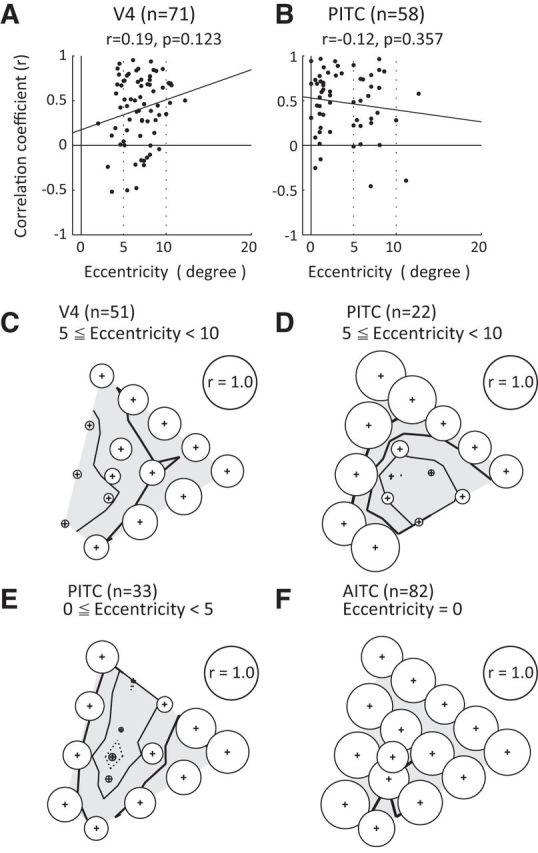
Figure 9.

Relationship between stimulus position and the magnitude of the effect of luminance contrast. A, B, Relationships between the eccentricity of the RF center (horizontal axis) and the magnitude of the effect of luminance contrast (vertical axis) quantified in terms of the correlation coefficient between responses to the bright and dark sets in neurons recorded from V4 (A) and the PITC (B). C, D, Correlation coefficients between the population responses to a bright stimulus and a dark stimulus across colors for subpopulations of V4 (C) and PITC (D) neurons that had RFs with centers ranging between 5 and 10° in eccentricity. E, F, Correlation coefficients between the population responses to a bright stimulus and a dark stimulus across colors for a subpopulation of PITC neurons that had RFs whose centers ranged between 0 and 5° in eccentricity (E) and AITC neurons (F). The format for C–F is the same as Figure 7, bottom.
