
Figure 2.
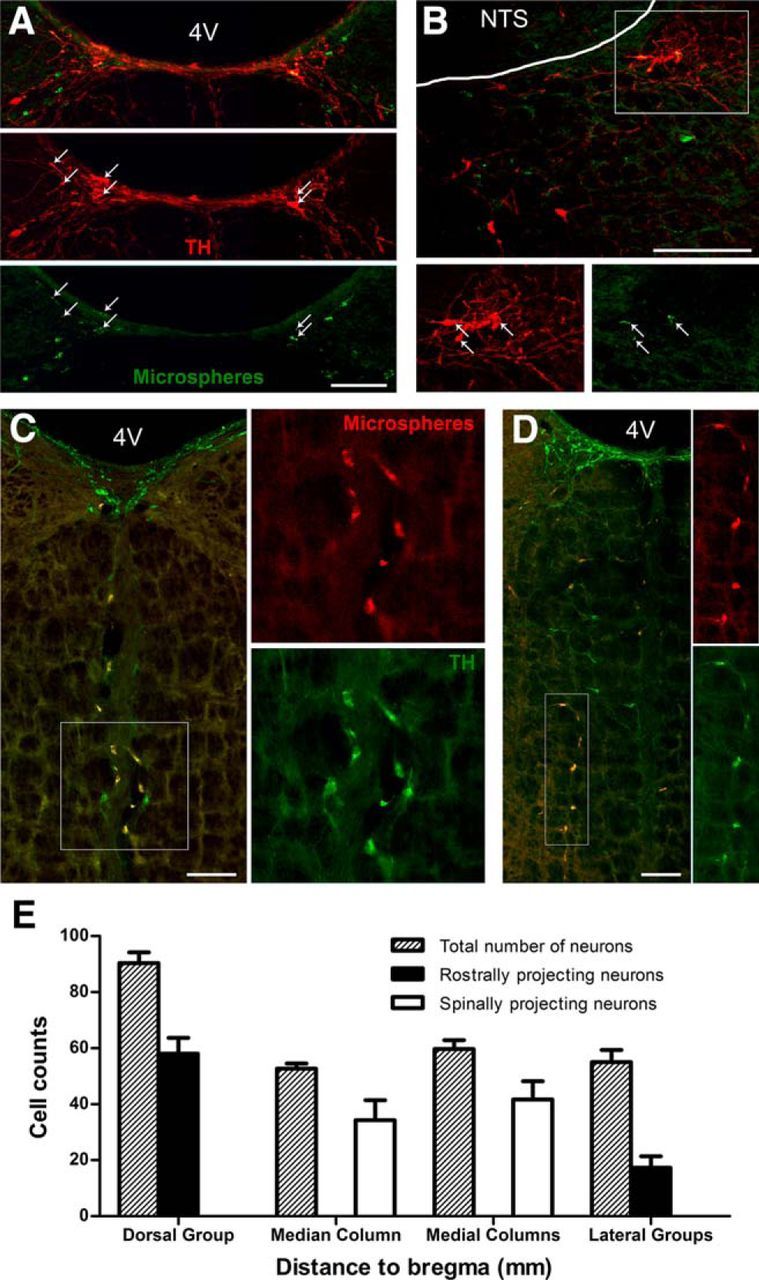
The dorsal and lateral C3 subgroups project rostrally; the median and medial C3 subgroups project caudally. Retrograde transport of green fluorescent microspheres injected into the pontine tegmental tract labels red TH-immunoreactive C3 neurons in the dorsal (A) and lateral (B) subgroups only. Merged images (top) and arrows indicate neurons containing both fluorescent microspheres and TH immunoreactivity. B, Bottom panels, Enlargement of the boxed area in the top panel. Orange fluorescent microspheres (red) injected into the IML at the third thoracic spinal segment label green TH-immunoreactive C3 neurons in the median (C) and medial (D) subgroups only. In the merged images (left panels), double-labeled neurons appear yellow. C, D, Right panels, Enlargement of the boxed area in the left panel. D, In this example, the TH-immunoreactive C3 neurons in the left medial column were retrogradely labeled from unilateral injections of orange fluorescent microspheres (red) in the right IML. E, Bar histogram showing average raw cell counts of total C3 neurons (dashed bars), rostrally projecting C3 neurons (black bars), and spinally projecting C3 neurons (white bars) in each of the four subgroups. Each bar represents mean cell counts throughout each subgroup ± SEM (n = 3). 4V, Fourth ventricle; NTS, nucleus of the tractus solitarius. Scale bars, 200 μm.