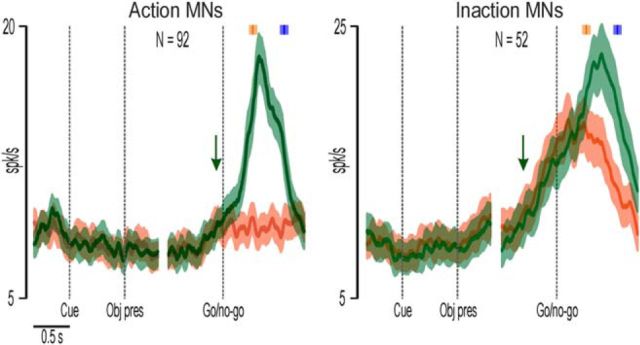
Figure 2.
Population activity of Action and Inaction MNs during both Action (green) and Inaction (red) conditions of the OT. In each part, the left side is aligned on the cue sound onset and object presentation (dashed vertical lines), while the right side is aligned on the go/no-go signal. The median time of reaching onset and object-pulling onset are indicated with the orange and blue markers, respectively, above each population plot. Shaded areas around each marker represent the 25th and 75th percentile times of other events of the same type. The green arrows indicate the onset timing of the action observation response. The green and red shadings around each curve represent 1 SE.

