
Figure 2.
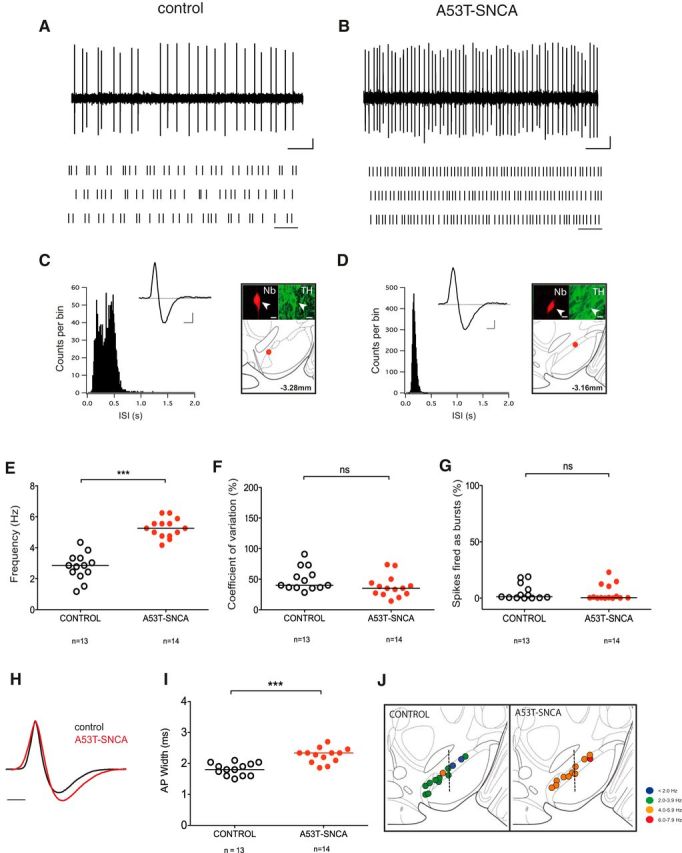
DA SN neurons in middle-aged A53T-SNCA mice show increased in vivo firing frequencies. A, B, Spontaneous extracellular in vivo single unit activity of identified DA SN neurons, shown as 10 s original recording trace, in control (A) and A53T-SNCA mice (B; Scale bar, 0.2 mV, 1 s) following 30 s raster plot (Scale bar, 1 s) of the DA SN neurons of the control (bottom left) and A53T-SNCA mice (bottom right). Note the change in the firing frequency between the two groups. C, D, ISIHs depict the pattern of firing of the DA SN neurons in the control (C) and A53T-SNCA mice (D). Inset, Averaged waveform showing biphasic extracellular action potential in high resolution (Scale bar, 0.2 mV, 1 ms) with corresponding confocal laser-scanning microscopy (CLSM) images of juxtacellularly labeled single DA SN neuron with multilabeling immunocytochemistry in the two groups, respectively (green, TH; red, Nb). Scale bar, 10 μm. Bottom, Map showing the location of juxtacellularly labeled single recorded rostral DA SN neuron. E–G, Scatter dot-plot showing significant increase in the in vivo firing frequency of the DA SN neurons in the A53T-SNCA mice (E). No significant difference is observed in the CV (F), and the number of SFBs (G) within the two groups, respectively. H, Overlaid plot of mean averaged action potential waveforms (normalized to 1) of DA SN neurons from middle-aged A53T-SNCA mice (red) and age-matched controls (black) recorded in vivo. Scale bar, 1 s. I, Scatter dot-plot of action potential duration of DA SN neurons of middle-aged A53T-SNCA and age-matched control mice, recorded in vivo. J, Frequency distribution map. The in vivo firing frequency of each DA SN neuron is color-coded (legend gives the frequency range) in the control and A53T-SNCA mice, respectively. Note that the DA SN neurons in the A53T-SNCA mice have high discharge frequencies. Line in the scatter dot-plot represents the median. Mann–Whitney test; ***p < 0.0005, *p < 0.05.