
Figure 3.
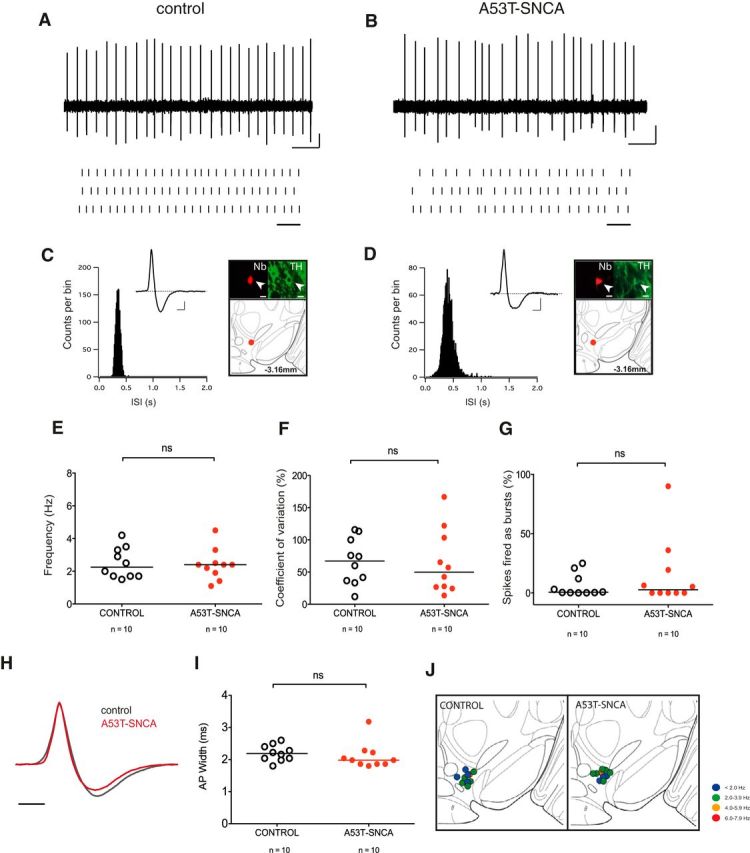
The in vivo activity of DA VTA neurons in middle-aged A53T-SNCA mice is not different from controls. A, B, Spontaneous extracellular in vivo single unit activity of identified rostral VTA (r-VTA) DA neurons, shown as 10 s original trace, in control (A), and A53T-SNCA (B), respectively, (Scale bar, 0.2 mV, 1 s) with corresponding 30 s raster plot at the bottom. Scale bar, 1 s. C, D, ISIH depicting the pattern of firing in the r-VTA DA neurons in the control (C) and A53T-SNCA mice (D) with respective averaged biphasic waveform (inset). Scale bar, 0.2 mV, 1 ms. CLSM of respective juxtacellularly labeled single r-VTA DA neuron along with multilabeling immunocytochemistry (bottom). The Nb-filled neurons (red) expressed TH (green) and were located in the r-VTA. Scale bar, 10 μm. Right, Map showing the location of juxtacellularly labeled single recorded r-VTA DA neuron (bregma −3.08 and −3.28 mm, respectively). E, In vivo firing frequency of the r-VTA DA neurons is not changed between control and A53T-SNCA mice. F, G, Shows no significant changes in the coefficient of variation and the SFB. H, Overlaid plot of mean averaged action potential waveforms (normalized to 1) of DA VTA neurons from middle-aged A53T-SNCA mice (red) and age-matched controls (black) recorded in vivo. Scale bar, 1 s. I, Action potential duration of DA VTA neurons in controls and middle-aged A53T-SNCA mice, recorded in vivo. J, Frequency distribution map. The in vivo firing frequency of each r-VTA DA neuron is color coded (legend gives the frequency range) in the control and A53T-SNCA mice, respectively. Line in the scatter dot-plot represents the median. ns, p > 0.05, Mann–Whitney test.