
Figure 4.
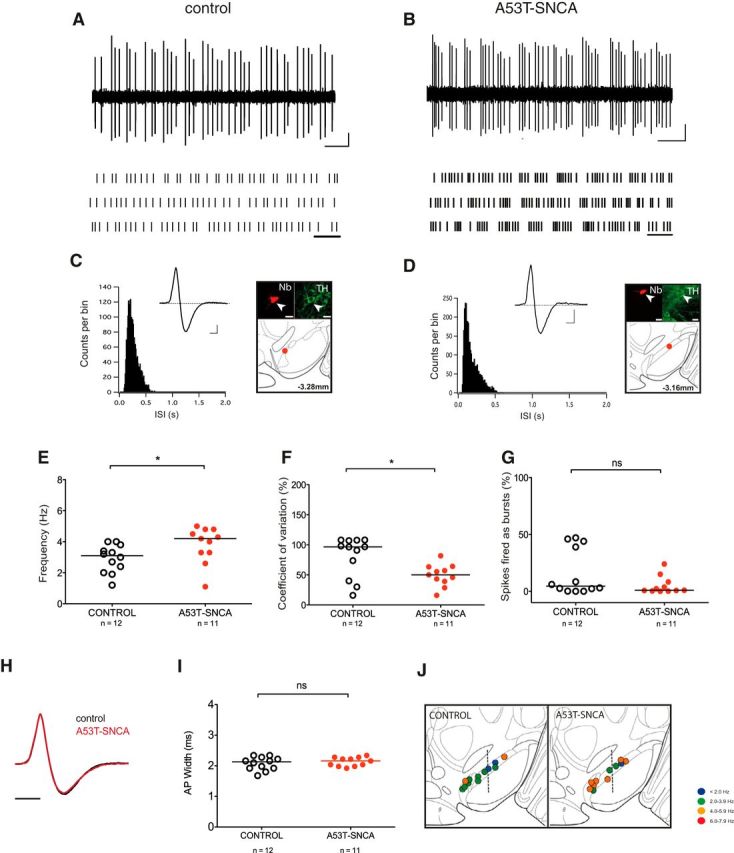
Mild in vivo firing phenotype in young adult DA SN neurons of A53T-SNCA mice. I, Spontaneous extracellular in vivo single unit activity of identified DA SN neurons in the 3 months old mice, shown as 10 s original trace, in control (A), and young A53T-SNCA (B), respectively (Scale bar, 0.2 mV, 1 s), with corresponding 30 s raster plot at the bottom. Scale bar, 1 s. C, D, ISIH depicting the pattern of firing in the DA SN neurons in the control (C) and young A53T-SNCA mice (D) with respective averaged biphasic waveform (inset). Scale bar, 0.2 mV, 1 ms. CLSM of respective juxtacellularly labeled single DA SN neuron along with multilabeling immunocytochemistry (bottom). The Nb-filled neurons (red) expressed TH (green) and were located in the SN. Scale bar, 20 μm. Right, Map showing the location of juxtacellularly labeled single recorded DA SN neuron (bregma −3.08 and −3.28 mm, respectively). E, G, In vivo firing frequency of the DA SN neurons in the young A53T-SNCA mice is significantly increased (E). There is a significant decrease in the CV in the young A53T-SNCA mice (F) and the SFB is not changed (G). H, Overlaid plot of mean averaged action potential waveforms (normalized to 1) of DA SN neurons from young adult A53T-SNCA mice (red) and age-matched controls (black) recorded in vivo. Scale bar, 1 s. I, AP duration of DA SN neurons in controls and young adult A53T-SNCA mice, recorded in vivo. J, Frequency distribution map. The in vivo firing frequency of each DA SN neuron is color-coded (legend gives the frequency range) in the control and young A53T-SNCA mice, respectively. Line in the scatter dot-plot represents the median; *p < 0.05; ns, p > 0.05, Mann–Whitney test.