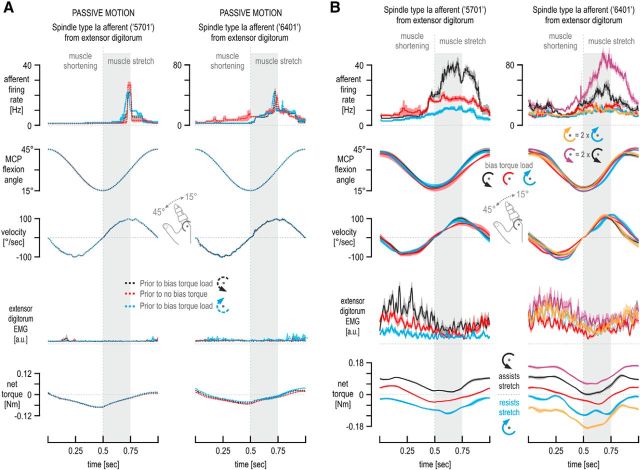
Figure 4.
Single afferent responses from passive and active muscle. A, Cycle-averaged responses of two type Ia afferents (same as in Fig. 3) along with the simultaneously recorded kinematics of the moving finger, spindle-bearing muscle EMG, and net torque, when the passive middle finger was continuously moved about its MCP joint by the servo machine (n = 10 cycles). Although recorded at different times (i.e., before active movement in a particular bias load condition), the responses were very similar across conditions, indicating that the state of the muscle and that of the spindles were not substantially different at the different recording times so as to affect spindle behavior in a systematic way during the subsequent active movement. B, Cycle averages as in Figure 3, but here the subjects moved against an inertial load (rather than viscous) in addition to any bias loads experienced. Traces represent means across repetitions (n = 10), and shaded colored areas represent ±1 SEM. The same effects of bias load on afferent firing rates were seen as in Figure 3. In fact, discharges of afferent 5701 (left column) were higher during the initial 250 ms of stretch when no bias load was applied (red traces) compared with when a bias load opposed flexion (blue traces), although the former case (red) was characterized by noticeably lower stretch velocities and smaller joint angles overall. Recording from afferent 6401 (right column) lasted long enough to apply bias loads of two magnitudes, as well as of two directions. Although the 0.124 Nm bias load in the direction of muscle stretch was accompanied by even higher firing rates than the 0.062 Nm bias load of the equivalent direction (purple vs black trace, top right), firing rates were similarly low when either the flexion-resistive 0.124 Nm load (orange traces) or the equivalent 0.062 Nm bias load were applied (blue traces), regardless of even higher EMG activity levels when the 0.124 Nm load was experienced (yellow traces) compared with the EMG levels during the baseline no bias load condition (red traces). Some EMG traces in the right column are represented by thinner lines and are shown without the corresponding SEMs for visual clarity.

