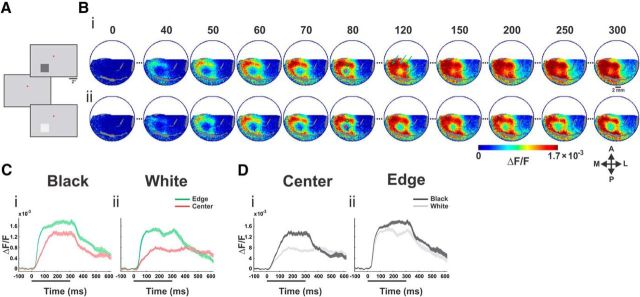
Figure 1.
Spatiotemporal response of VSD signal evoked by black/white stimuli. Population responses to black and white square stimuli from one example imaging session. A, Following fixation on a uniform gray screen, a 2 × 2° square appeared. In the current example, the stimuli were centered at 1.75° left of the fixation point (red dot) and 3.0° below. The squares had either negative contrast (“Black,” −64%) or positive contrast (“White,” +64%) with respect to the background luminance. B, Average VSD activation maps evoked by a 300 ms presentation of black stimulus (Bi) and white stimulus (Bii); n = 12 trials. Big blood vessels are colored in gray (here and in all other figures). Numbers correspond to milliseconds after stimulus onset. The arrows (map at t = 120) point to the spatial modulation in the upper and right edges. The three green arrows point to the evoked neural response at the corners and the two cyan arrows point to the evoked response at the edge middles of the square stimulus. A, anterior; P, posterior; M, medial; L, lateral. C, Time courses of the evoked population response for the black (Ci) and white (Cii) stimulus. Time courses are computed for ROIs (depicted in B, on the map at t = 80, red and green circles) located at the center and at the edge of the evoked pattern. Trace width denotes ±1 SEM over trials. Stimulus duration is denoted by a black bar below the x-axis. D, Same as in C but grouped by center ROI (Di) and edge ROI (Dii) for comparison between the black and the white responses.

