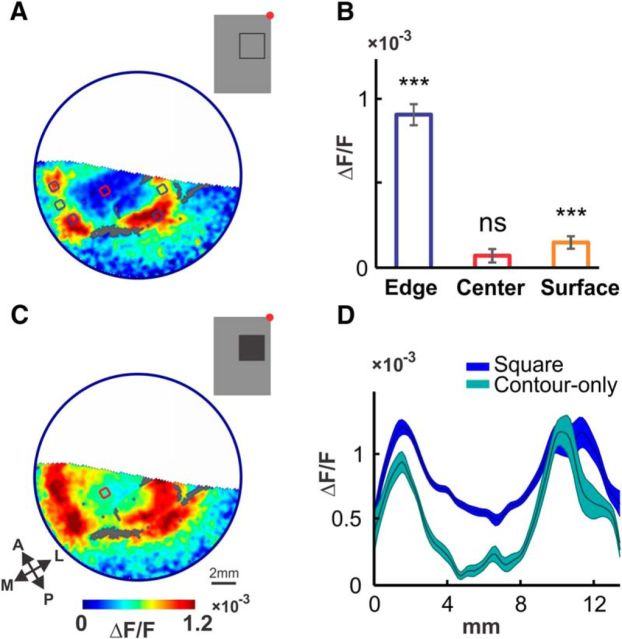
Figure 4.
Different contributions of contrast responses and surface responses. A, VSD activation pattern evoked by a 2 × 2° square contour stimulus (inset, red dot marks the fixation point), presented 1.5 left of the fixation point and 2.5° below for 300 ms, averaged 60–100 ms (n = 11 trials, large blood vessels are colored gray). Blue and red regions (area 0.46 mm2) depict the ROIs used to measure edge and center activation, respectively. B, Average activation evoked by the stimulus in A at the edges (blue) and center (red) ROIs, and at the center region of the response evoked by a large surface stimulus (orange), centered at the same location as A (size 8 × 8°, n = 21 trials). Significance of >0 activation measured by Wilcoxon signed rank test (***p < 0.001). C, VSD pattern evoked by a 2 × 2° square surface stimulus (inset) presented at (−1.5 and −2.5°) for 300 ms, averaged 60–100 ms (n = 20 trials, large blood vessels are colored gray). Red region depicts ROI used to measure center activation, same one as in A. D, Comparison of spatial profiles of the responses shown in A (cyan curve) and C (blue curve, shading marks ±1 SEM). Paths spanned the top-left corner, center, and bottom-right corner of both responses (1.2 × 13.6 mm). Curves smoothed with a Gaussian (σ = 0.17 mm) for visualization purposes. Center activation in response to the filled square is clearly present and much higher than that evoked by the square contour.

