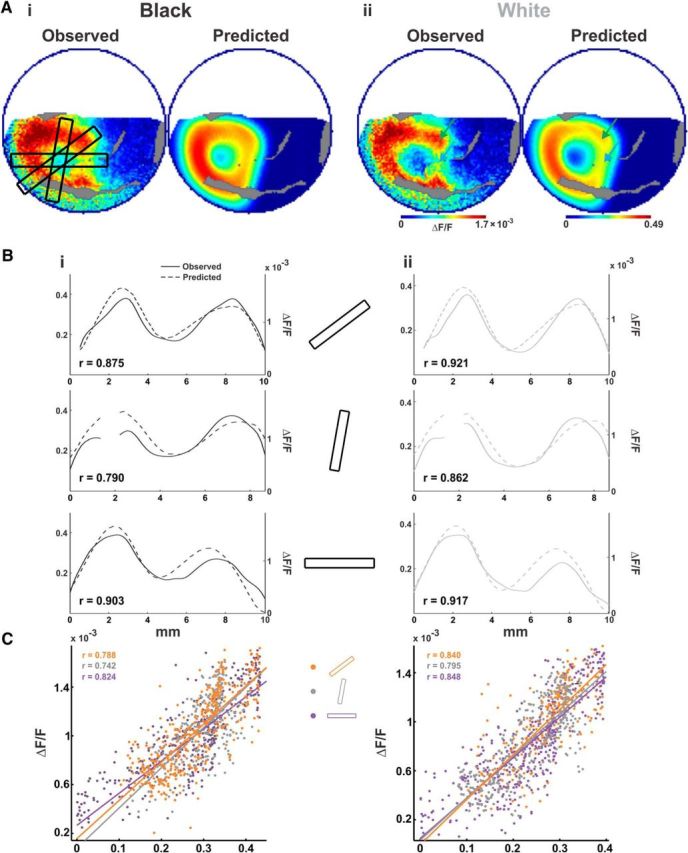
Figure 6.

Model performance—observed versus predicted. Evaluation of model performance on the example session from Figure 1. A, Spatial maps of the observed VSD signal from one imaging session (maps averaged over 60–100 ms post-stimulus onset) and the predicted maps. Ai, Black stimulus. Aii, White stimulus. B, Spatial paths over the maps in A, showing three spatial profiles (marked over the left map in Ai) that pass through the center, corners, and edges of the black (Bi) and white (Bii) patterns. Solid curves show the observed response, and dashed curves show the predicted response (gaps in the curves correspond to blood vessels). Left y-axis is for the predicted response; right y-axis is for the observed response. Ordinate ranges are set between 0 and mean + 2 SD for each curve individually. C, Scatter plots of the expected versus the observed response of all the pixels in the three spatial profiles for black (Ci, left) and white (Cii, right), along with regression lines for each section and r values.
