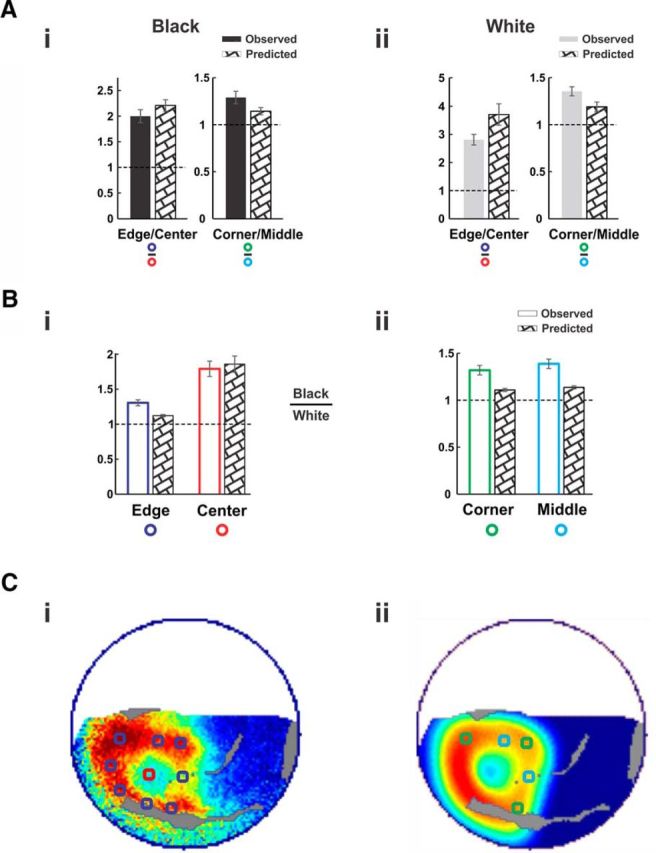
Figure 7.

Model performance—average over all sessions. Quantification of model prediction performance for spatial and black/white ratios, averaged over all n = 9 sessions. A, Observed and predicted responses in the ROIs. Locations of ROIs are depicted in Ci and Cii for Ai, Bi, and Aii, Bii, respectively (see Materials and Methods). Ai, Left, Depicts the ratio between the edges and the center for black; right depicts the ratio between the corners and the edge middles for black. Error bars are ±1 SEM over sessions. Aii, Same as Ai but for the responses to the white square. B, The ratios between the black and white responses in all four ROI types: edges and center (Bi) and corners and edge middles (Bii). C, Illustration of ROIs on an example map and corresponding predicted map from session shown in Figure 1. Ci, ROIs corresponding to square edges (blue) and to the center (red), superposed on a response map. Cii, ROIs corresponding to square corners (green) and to the edge middles (cyan), superposed on the corresponding predicted map.
