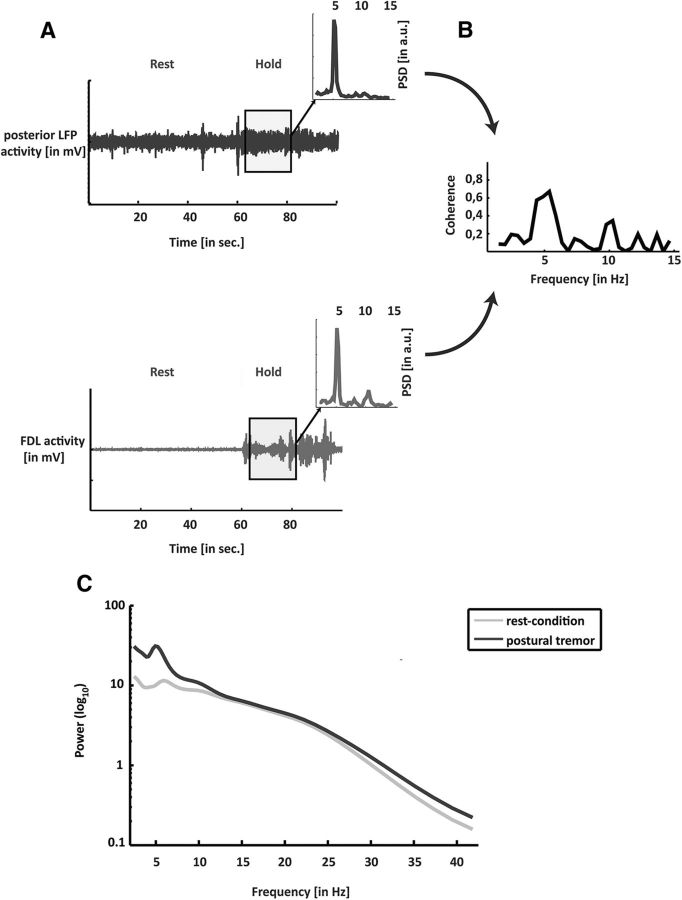
Figure 1.
A, Raw data of the LFPs of the posterior electrode of the VLp over time and the contralateral EMG (FDL). The inset shows the power spectrum of the data highlighted in gray. B, Coherence of both data tracks (EMG and LFP) for the data in the rectangle. C, Power spectra pooled across all subjects (n = 10) for the rest condition (light line) and the hold condition (dark line).

