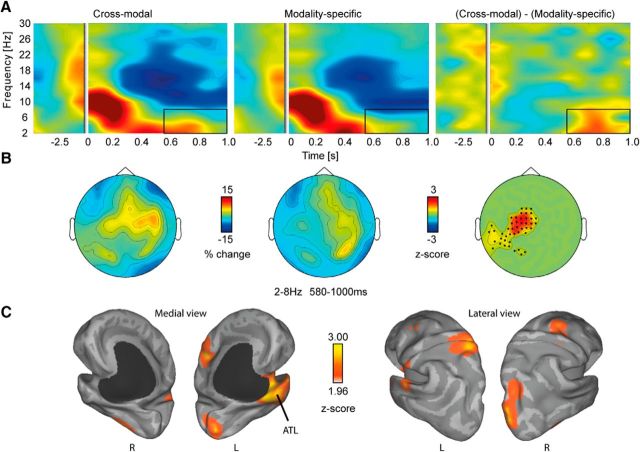
Figure 2.
Low-frequency oscillations in sensor and source space. A, Total power changes in the CM and MS condition relative to a 500 ms fixation baseline. Right, Statistical differences between conditions averaged over the identified cluster. The box depicts the significant time–frequency range. B, Topographies showing relative signal change across magnetometers between 2 and 8 Hz and between 580 and 1000 ms. Right, Significant channels are marked as dots. C, Source reconstruction revealed peaks in the ATL and parietal lobe.

