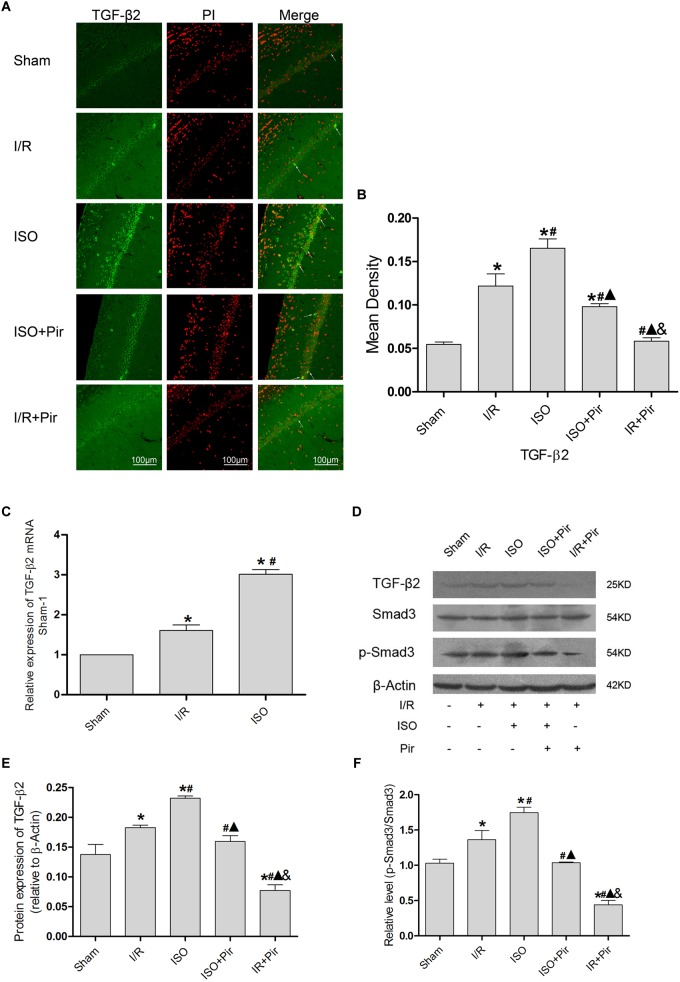
FIGURE 5.
Expression of the TGF-β2/Smad3 signaling pathway in the hippocampus of rats. (A) showed CA1 region IF of TGF-β2. → indicates the position of TGF-β2. (B) showed the mean fluorescence density analysis in each group. (C) Expression of TGF-β2 mRNA. (D) Proteins expression levels of the TGF-β2/Smad3 signaling pathway. (E) Western blot analysis of TGF-β2. (F) Western blot analysis of p-Smad3/Smad3. Scale bars = 100 μm. Data are shown as the mean ± SD (n = 3). ∗
P < 0.05 vs. Sham; # P < 0.05 vs. I/R;  P < 0.05 vs. ISO; & P < 0.05 vs. ISO + Pir.

