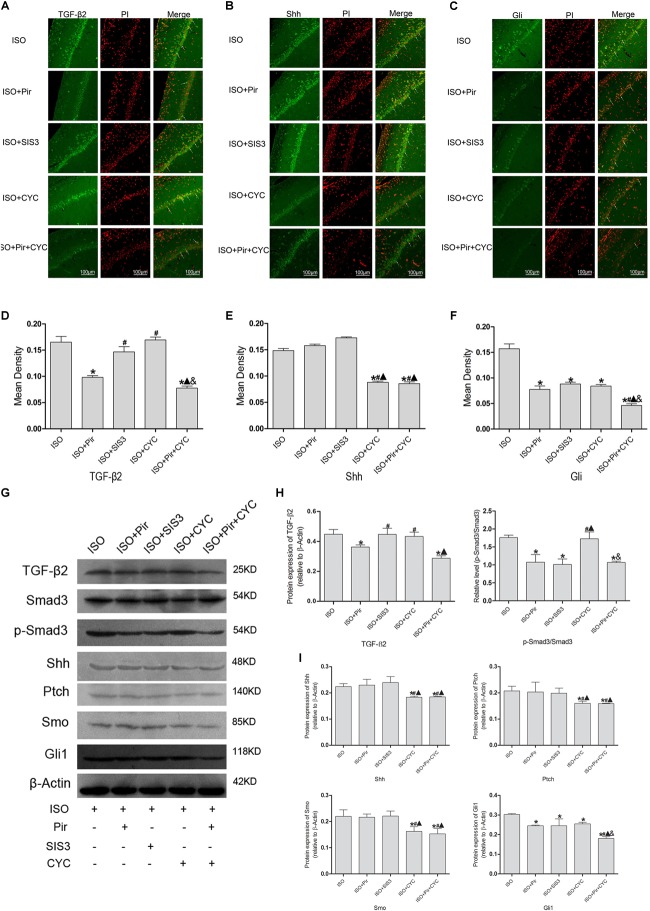
FIGURE 7.
Expression of the TGF-β2/Smad3 and Shh/Gli signaling pathway in the hippocampus of rats with ISO post-conditioning after cerebral I/R injury. (A) showed CA1 region IF of TGF-β2. → indicates the position of TGF-β2. (B) showed CA1 region IF of Shh. → indicates the position of Shh. (C) showed CA1 region IF of Gli1. → indicates the position of Gli1. (D) showed the mean fluorescence density of TGF-β2. (E) showed the mean fluorescence density analysis of Shh. (F) showed the mean fluorescence density analysis of Gli1. (G) Proteins expression levels of the TGF-β2/Smad3 and Shh/Gli signaling pathways. (H) Western blot analysis of the TGF-β2/Smad3 signaling pathway. (I) Western blot analysis of the Shh/Gli signaling pathway. Scale bars = 100 μm. Data are shown as the mean ± SD (n = 3). ∗
P < 0.05 vs. ISO; # P < 0.05 vs. ISO + Pir;  P < 0.05 vs. ISO + SIS3; & P < 0.05 vs. ISO + CYC.

