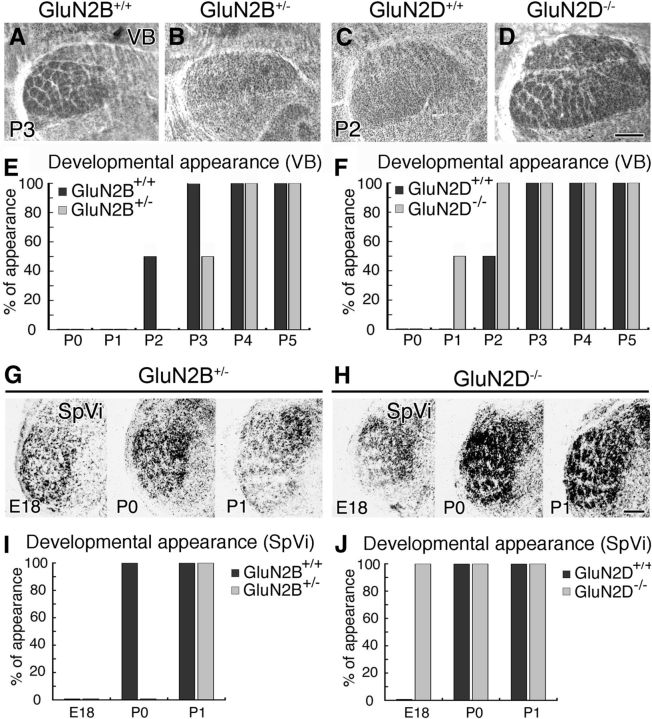
Figure 2.
Opposing temporal shift in developmental appearance of thalamic barreloids and brainstem barrelettes between GluN2B+/− and GluN2D−/− mice. A–D, Cytochrome oxidase-stained thalamic VB. Note the appearance of segregated barreloids in control (A), but not GluN2B+/− (B), mice at P3. Also note the appearance of segregated barreloids in GluN2D−/− (D), but not control (C), mice at P2. E, F, Bar graphs representing 1 day delay of barreloid appearance in GluN2B+/− mice (E) and 1 day advance in GluN2D−/− mice (F). G, H, Cytochrome oxidase-stained subnucleus interpolaris (SpVi) in GluN2B+/− (G) and GluN2D−/− (H) mice at E18 (left), P0 (middle), and P1 (right). Note the first appearance of segregated barrelettes in GluN2B+/− mice at P1, and in GluN2D−/− mice at E18. I, J, Bar graphs representing 1 day delay of barrelette appearance in in GluN2B+/− mice (I) and 1 day advance in GluN2D−/− mice (J). The number of mice examined at each stage is listed in Table 2 (bottom and middle). Scale bars, 200 μm.

