
Figure 13.
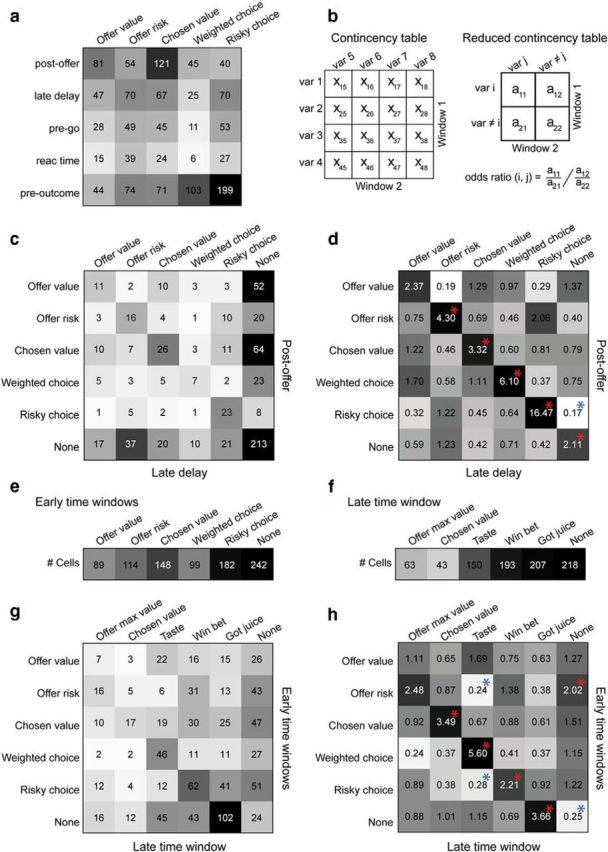
Comparing classifications across time windows. a, Neuronal responses in early time windows. Each response was assigned to the selected variable providing the best explanation (highest R2). Each location indicates number of responses assigned to one variable in one time window. The same numbers are also depicted in gray scale. b, Illustration of odds ratio statistics (see Materials and Methods). c, Classification across first two time windows. Time windows postoffer and late delay are represented by rows and columns, respectively. In the contingency table, each location indicates the number of neurons assigned to a particular pair of variables. Cells that were not task-related in a given time window were labeled “None.” d, Classification across first two time windows, odds ratio. Same data as in c expressed as odds ratios. Each location indicates numerically the odds ratio measured for a particular pair of variables. The log(odds ratio) is also depicted in gray scale. Chance level corresponds to odds ratio = 1. Notably, odds ratio is >1 for each location on the diagonal (i.e., cases of consistent classification). A statistical test was run for each location in the contingency table. Asterisks indicate a significant departure from chance level (p < 10−3, odds ratio test). The departure could be positive (odds ratio, >1; red asterisks) or negative (odds ratio, <1; blue asterisks). e, Population summary for early time windows. Assuming consistent encoding, we assigned each cell to the variable that provided the highest explanatory power across the early time windows (sum of R2). The number of cells assigned to each variable is indicated numerically and in gray scale. f, Population summary for postoutcome time window. Each neuron was assigned to the postoutcome variable that proved the highest R2. g, Early time windows versus postoutcome. Same format as in c. In this case, early time windows and the postoutcome time window are represented by rows and columns, respectively. Each location indicates the number of neurons assigned to a particular pair of variables. h, Early time windows versus postoutcome, odds ratio. Same data as in g expressed in odds ratios. Conventions as in d.