
Figure 3.
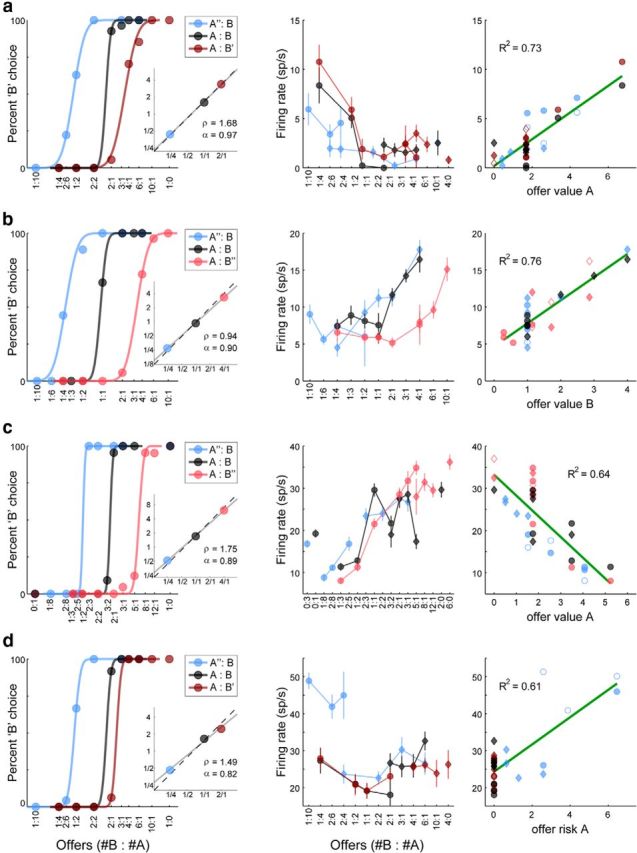
Neuronal encoding of variables related to individual offers. a, Neuronal response encoding offer value A (reaction time window). The left panel illustrates the results of the behavioral analysis (same format as in Fig. 1b,c). In this session, the relative value of the two juices was ρ = 1.68 and the animal's choices were close to risk-neutral (α = 0.97). The center panel illustrates the firing rate (y-axis) as a function of the offer type (x-axis). Offer types are ranked by the ratio #B:#A and each data point represents one choice type (independent of the trial outcome). Circles and diamonds represent, respectively, choice types in which the animal chose juice A and juice B. The firing rate depended on both the quantity and the probability of juice A. The right panel shows the firing rate as a function of the variable offer value A. Each data point represents one trial type. Filled/empty symbols indicate, respectively, trial types in which the animal did/did not obtain the juice. The green line shows the result of a linear regression (R2 indicated in the upper left). Note that each data point in the center panel for which the choice outcome was uncertain corresponds to two data points in the right panel. Values are expressed in units of juice B (uB). b, Neuronal response encoding offer value B (postoffer time window). c. Neuronal response encoding offer value A (postoffer time window). In this case, the firing rate decreased with increasing offer value A (negative encoding). d. Neuronal response encoding offer risk A (preoutcome time window). The firing rate was highest when juice A was offered with p = 0.25.