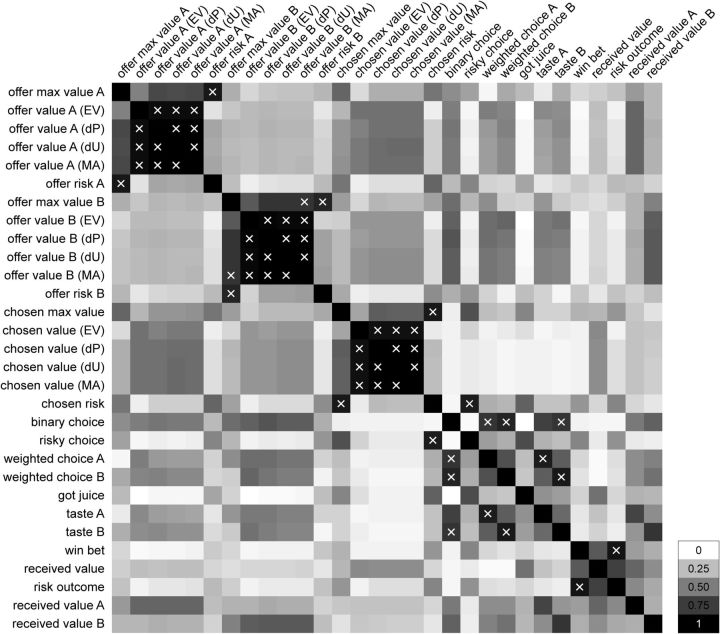
Figure 5.
Intrinsic correlation between variables. The 30 variables defined in Table 1 were often correlated with each other. To estimate the typical correlation between any two variables X and Y, we computed for each session the correlation coefficient , where x⃗ and y⃗ are vectors of values taken by variables X and Y for different trial types. The correlation coefficient varied between −1 and +1. Most informative for our purposes was the absolute value, which we computed and average across sessions: . Repeating for all pairs of variables, we obtained a symmetric matrix ρ of elements ρ(X, Y) that varied between 0 and 1. The figure depicts in gray scale the correlation coefficient between each pair of variables. Pairs for which the correlation was >0.8 are indicated with an X. The scale is indicated on the bottom right.

