
Figure 7.
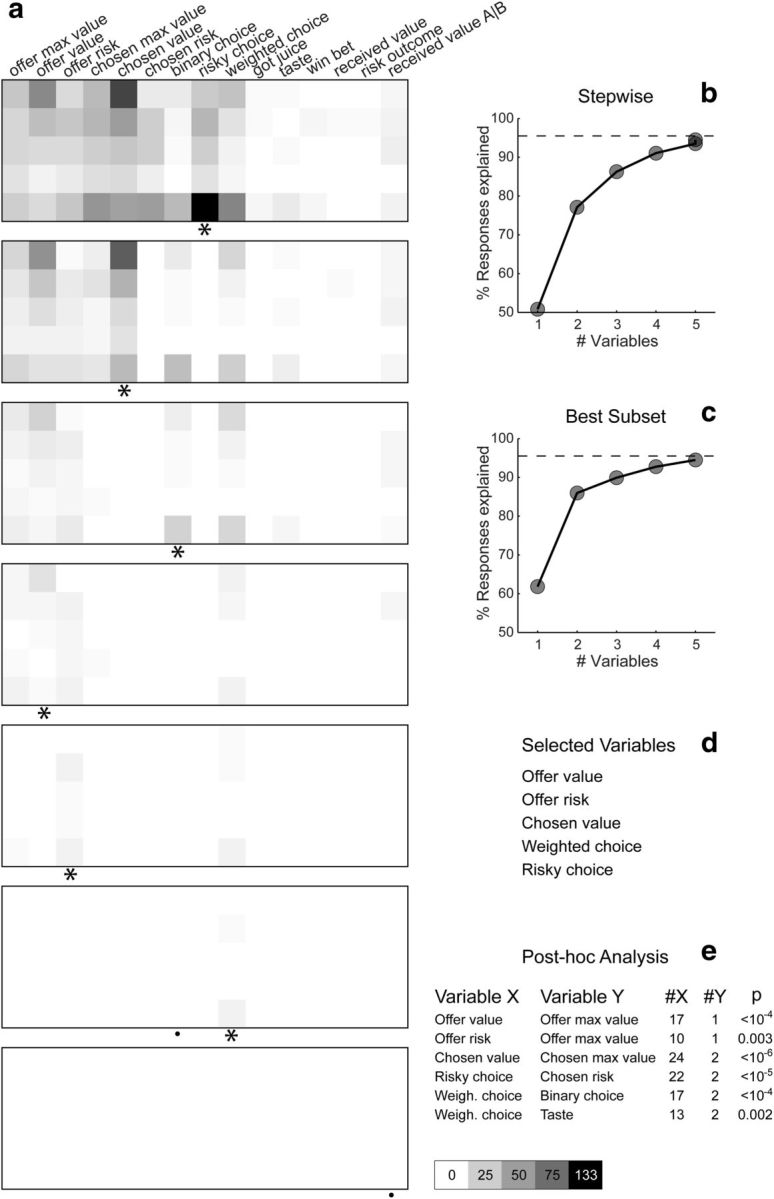
Variable selection analysis. a, Stepwise selection. The top panel is as in Figure 6b (restricted to early time windows). At each iteration, the variable providing the maximum number of best fits in a time window was selected and indicated with an asterisk in the figure. All the responses explained by the selected variable were removed from the pool and the procedure was repeated on the residual dataset. Selected variables whose marginal explanatory power was <1% were eliminated (see Materials and Methods) and indicated with a black dot in the figure. In the first five iterations, the procedure selected variables risky choice, chosen value, binary choice, offer value, and offer risk. In the sixth iteration, the procedure selected weighted choice and eliminated binary choice. No other variables were selected in subsequent iterations. The scale is indicated on the bottom right. b, Stepwise selection, percentage of explained responses. The y-axis represents the percentage of responses explained at the end of each iteration. The total number of task-related responses (1490) corresponds to 100%. The number of responses explained by ≥1 of the variables included in the analysis (1423 of 1490, 96%) is indicated with a dotted line. The five selected variables collectively explained 1410 responses, corresponding to 95% of task-related responses and to 99% of responses explained by ≥1 variable. c, Best-subset selection, percentage of explained responses. Same format as in b. d, Selected variables. e, Post hoc analysis. Each of the selected variables (variable X) competes with challenging variables (variable Y). The column denoted #X indicates the number of responses explained by variable X, not explained by any of the other selected variables, and not explained by variable Y. Similarly, #Y is the number of responses explained by variable Y, not explained by other selected variables, and not explained by variable X. The last column indicates the p value obtained from a binomial test. For each comparison, the explanatory power of the selected variable was significantly higher than that of the competing variable (all p < 0.005).