
Figure 9.
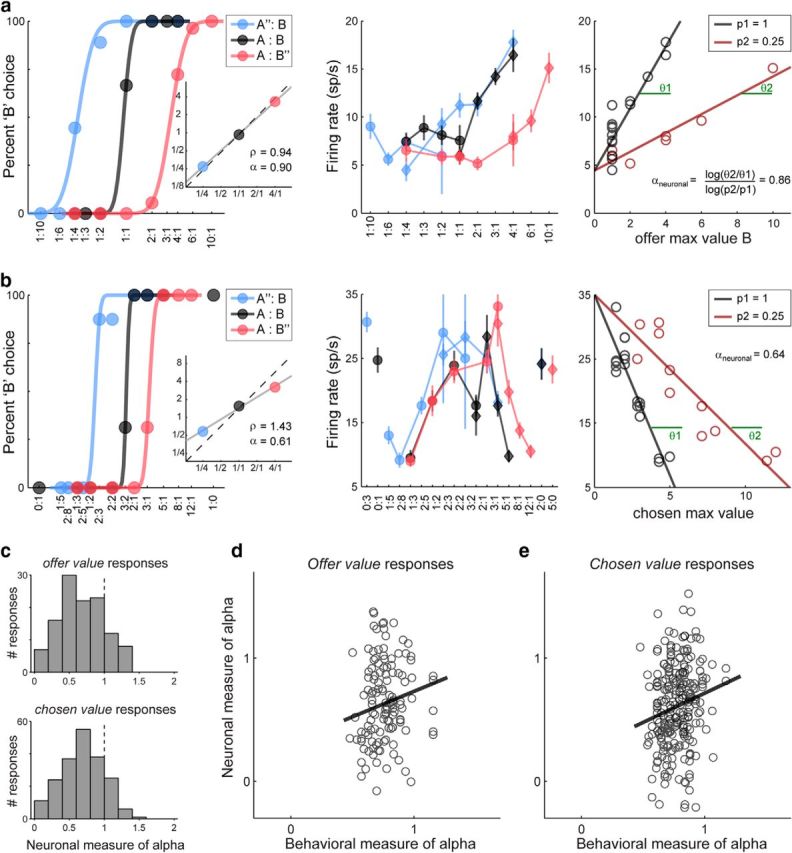
Value-encoding neuronal responses reflect the risk attitude. a, Neuronal measure for α, offer value. Same response as in Figure 3b. In the rightmost panel, the firing rate is plotted against the variable offer B max value (equal to #B) separately for trials in which juice B was offered with p = 1 and p = 0.25. Each data point represents a choice type and lines are obtained from a linear regression. For this response, αneuronal = 0.86 while αbehavioral = 0.90 (leftmost panel, inset). b, Neuronal measure for α, chosen value. The same procedure as in a was used for chosen value response and for responses with negative slope. Thus a separate measure of αneuronal was obtained for each response and for each probability level p < 1. Measures of αneuronal obtained with different probability levels were then combined in the population analyses. c, Distribution for αneuronal. Top and bottom panels refer to the populations of offer value and chosen value responses, respectively. In both cases, mean(α) < 1 (both p < 10−10, t test). In other words, neuronal responses reflect the overall risk attitude of the animals. Histograms shown here illustrate the results obtained when responses were classified using EV variables (see main text). d, e, Neuronal versus behavioral measures of risk attitude (d, offer value; e, chosen value). In each panel, each symbol represents one response and the black line is obtained from a linear regression. Neuronal measures for α are generally noisy. However, the two measures were significantly correlated (r = 0.16 for offer value responses; r = 0.17 for chosen value responses). The two panels shown here illustrate the results obtained when responses were classified using MA variables (see main text).