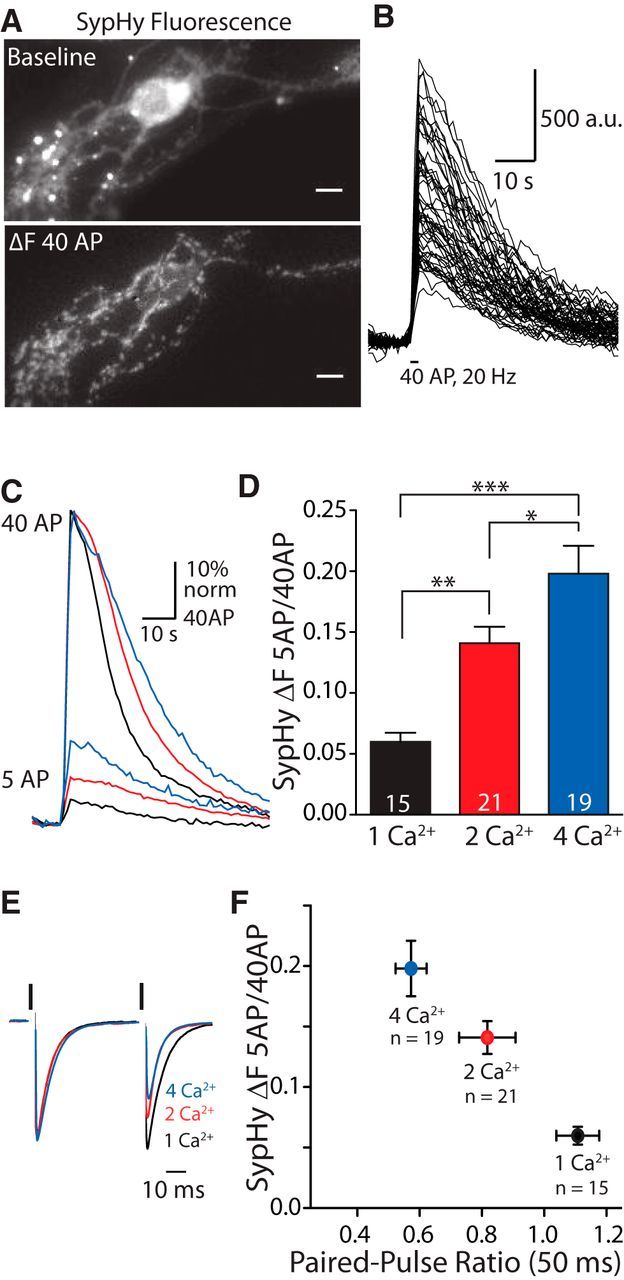
Figure 1.

SypHy imaging reveals differences in release probability with high sensitivity. A, Example image of WT hippocampal autapse expressing SypHy at baseline (left) and after stimulation with 40 APs at 20 Hz (right; baseline subtracted) in 2 mm Ca2+. Images were set to the same intensity range. Scale bars, 10 μm. B, Quantification of change in fluorescence over time from ROIs selected from the cell in A. C, Average ΔF responses per cell to 5 APs given at 2 Hz normalized to the peak of the 40 AP (20 Hz) signal in example cells recorded in 1 (black), 2 (red), or 4 (blue) mm [Ca2+]e. D, Bar graph of average ratios of the SypHy ΔF signal in response to 5 APs at 2 Hz over that in response to 40 APs at 20 Hz calculated per cell recorded in [Ca2+]e of 1 (black), 2 (red), or 4 (blue) mm. Measurements with different [Ca2+]e values were compared between cells. n values represent the number of cells. Significance was determined by one-way ANOVA with Tukey post hoc test: *p ≤ 0.05; **p ≤ 0.01; ***p ≤ 0.001. E, Example EPSC responses to the first two pulses in a 40 AP train at 20 Hz in cells recorded in 1 (black), 2 (red), or 4 (blue) mm [Ca2+]e. Responses are scaled to the peak of the first response. Black bars indicate 70 mV depolarization. The depolarization artifact has been blanked for illustrative purposes. F, Average 5 AP/40 AP SypHy ratio plotted against the average PPR (interstimulus interval, 50 ms) recorded from the same cells in [Ca2+]e, as indicated. n values equal the number of cells. For all graphs, error bars represent the SEM.
