
Figure 2.
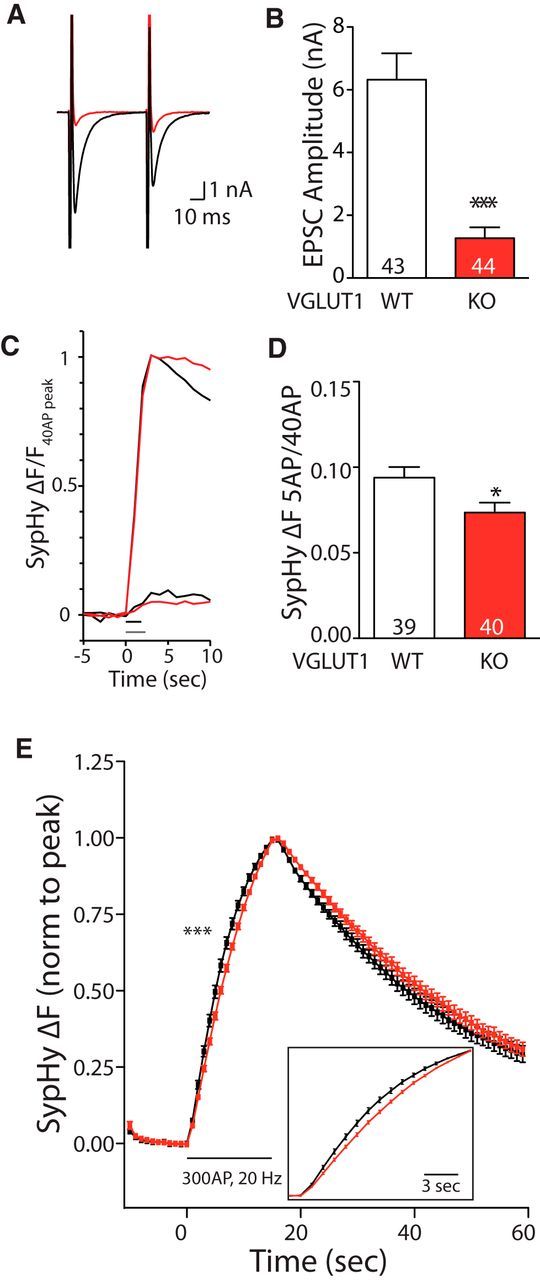
VGLUT1 KO autapses show decreased release probability with SypHy measurements. A, Example traces of EPSCs produced in WT (black) or VGLUT1 KO (red) autapses also expressing SypHy. B, Average EPSC amplitudes produced in WT and VGLUT1 KO autapses expressing SypHy. Signficance determined by Mann–Whitney U test: ***p < 0.0001. C, Example SypHy ΔF signal produced by 5 APs at 2 Hz and 40 APs at 20 Hz averaged per cell and normalized to ΔF 40 APs for a WT (black) and VGLUT1 KO (red) autapses. Bars parallel to the x-axis indicate stimulation with 5 APs (2 Hz; gray) or 40 APs (20 Hz; black). D, Average SypHy ΔF 5 AP/40 AP signal ratio recorded in WT and VGLUT1 KO autapses. For B and D, significance was determined by Student's t test: *p = 0.019. E, Average SypHy ΔF response to 300 APs, 20 Hz, normalized to the peak per cell for WT (black; n = 33) and VGLUT1 KO (red; n = 36) autapses. Significance indicates comparison of 20–80% rise times (Student's t test, ***p = 0.0003). For all panels, n values (number of cells) are indicated in graphs; error bars represent the SEM.