
Figure 6.
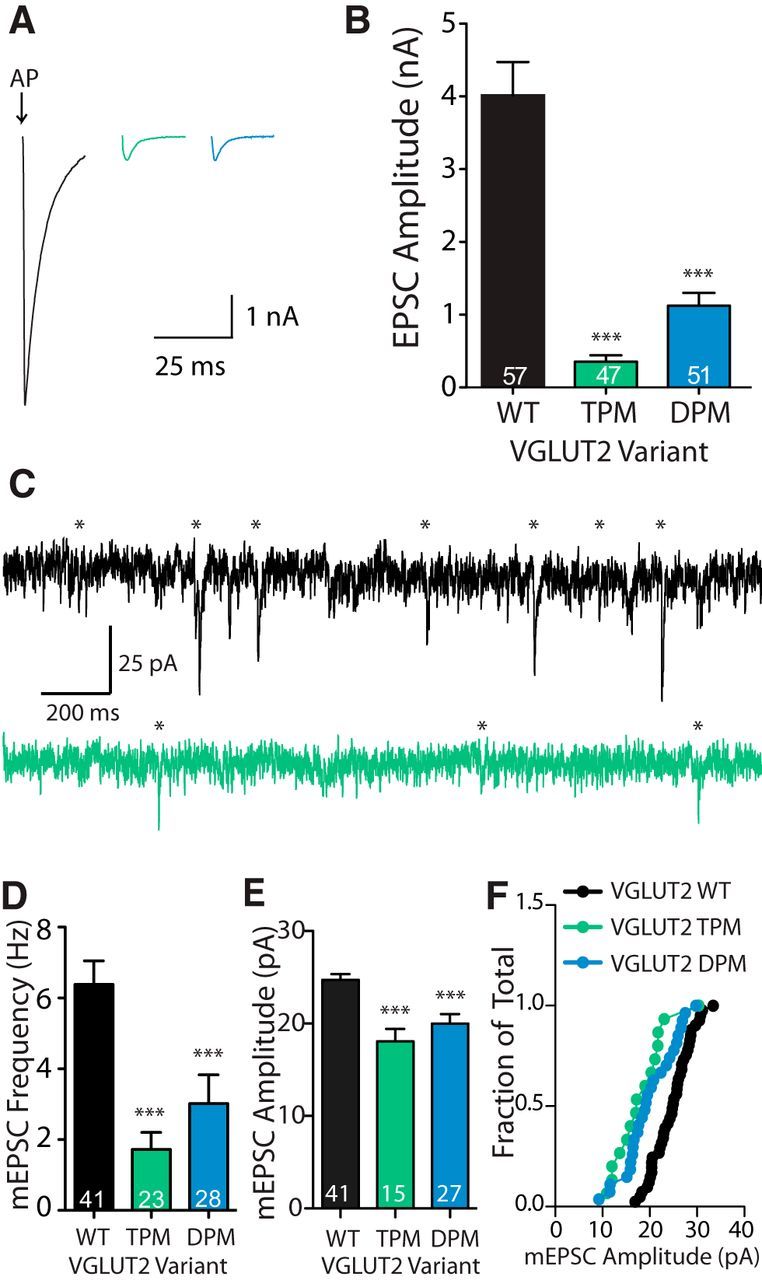
Mutation of putative transport residues renders VGLUT2 transport deficient. A, Example response (average, four traces) of VGLUT1 KO autapses rescued with VGLUT2 WT (black), VGLUT2 TPM (R184K R88Q R322Q; green), or VGLUT2 DPM (R184K R88Q; blue). Arrow indicates 70 mV depolarization. Depolarization artifacts have been blanked for illustrative purposes. B, Quantification of average EPSC amplitude recorded from many autaptic neurons (n values indicated in graph) over three cultures. Significance was determined by Kruskal–Wallis test with Dunn's post-test. ***p ≤ 0.001. C, Example traces of mEPSC recordings from VGLUT1 KO autapses expressing VGLUT2 WT (black) or VGLUT2 TPM (green) proteins. Template-detected events indicated by asterisks. D, E, Quantification of average mEPSC frequency (D) and amplitude (E). F, Cumulative frequency distribution of average mEPSC amplitude for each cell included in the average mEPSC amplitude (E). Significance was determined by Kruskal–Wallis test with Dunn's post-test (D) or one-way ANOVA with Tukey post hoc test (E): ***p ≤ 0.001. For all graphs, error bars represent the SEM. n values, representing the number of cells, are indicated in the graphs.