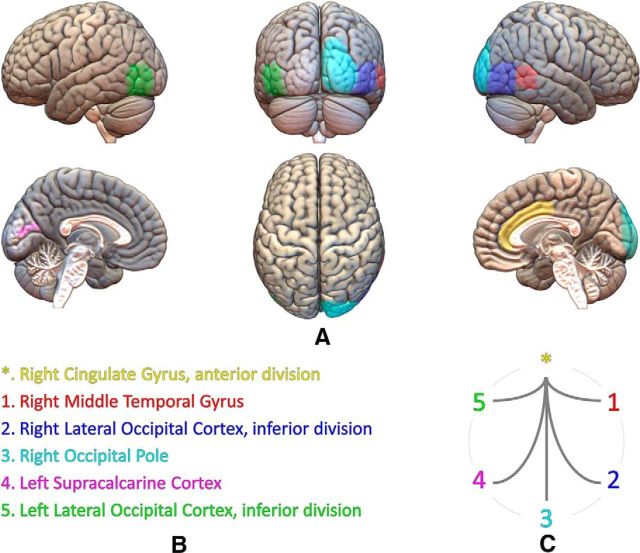
Figure 2.
Cortical areas implied in the five connectivity links that showed significant differences between groups. A, Different views of the brain based on the MNI template and Harvard–Oxford cortical areas involved in those links. B, Relation of areas, numbers, and colors. C, Significant connectivity links established between those areas.

