Figure 1.

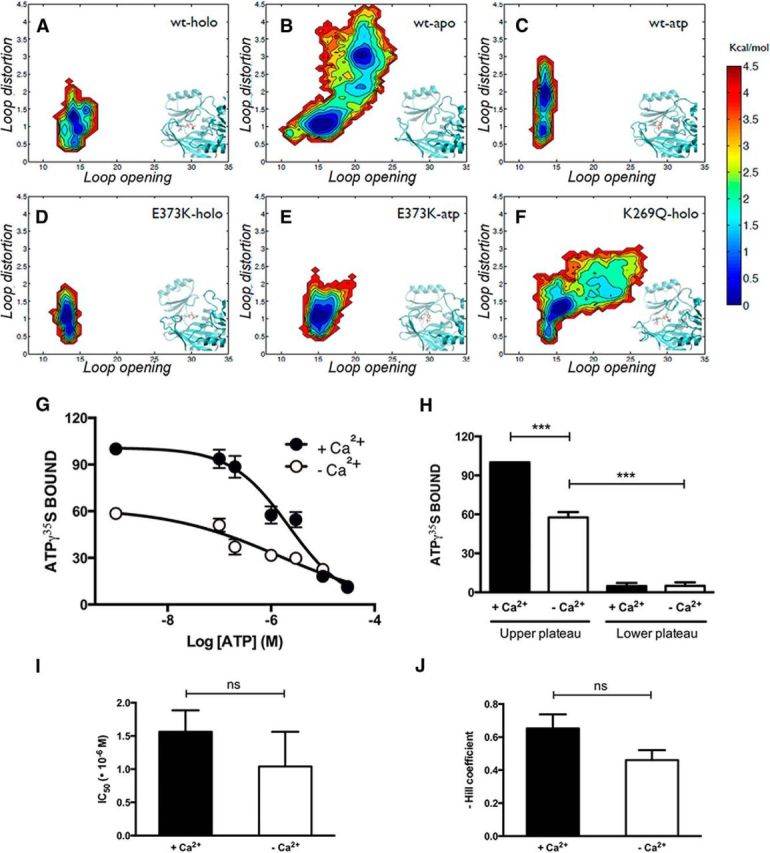
The presence of Ca2+ potentiates, but it is not necessary for, the binding of ATP to SynI. A–F, Free energy surfaces describing the conformations of the MFL calculated from MD simulations are shown. The reaction coordinates used are the distance between the centers of mass of the MFL residues 336–338 and residue 315 (x-axis), and the RMSD of the MFL with respect to its conformation in the crystal structure (y-axis). Results for the following systems are shown: WT-SynI with ATP and Ca2+ (holo; A), WT-SynI without ATP or Ca2+(apo; B), WT-SynI with ATP but no Ca2+ (atp; C),E373K mutant with ATP and Ca2+ (D), E373K mutant with ATP and no Ca2+(E), and K269Q mutant with ATP and Ca2+ (F). Insets, Representative conformations of the protein region in the vicinity of the MFL and the ATP binding site are shown. G, Inhibition of ATP-γ35S (20 nm) binding to purified bovine SynI (500 nm) by increasing concentrations of cold ATP in the absence (open symbols) or presence (closed symbols) of Ca2+ (2.1 mm). The amount of bound ATP-γ35S is expressed in percentage of the binding in the absence of cold ATP and presence of Ca2+. Points in the plot are mean ± SEM of five independent experiments. H–J, Individual inhibition curves were fitted as described in Materials and Methods. Percentage of the amount of bound ATP-γ35S at the upper and lower plateau (H), IC50 values of cold ATP (I), and Hill slope (J) of the fitted functions in the absence (open bars) or presence (solid bars) of Ca2+ are shown as mean ± SEM. Statistical analysis was performed using the Student's t test or one-way ANOVA followed by the Bonferroni's multiple-comparison test; ***p < 0.001; ns, not significant.
