Figure 4.
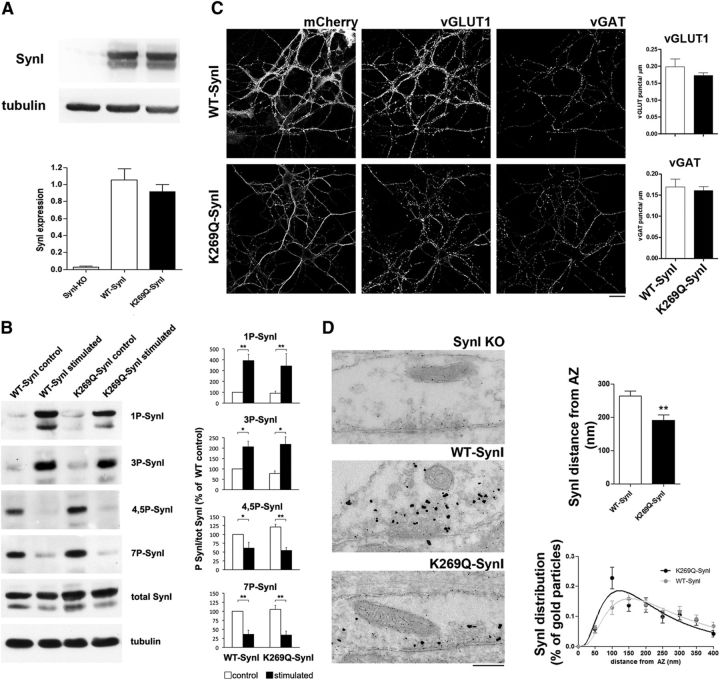
The ATP binding mutant alters SynI distribution within nerve terminals without affecting its phosphorylation or the density of excitatory and inhibitory synapses. A, Expression of WT-SynI and K269Q-SynI. Primary hippocampal neurons from SynI KO mice were transduced at 7 DIV with lentiviral vectors encoding either WT-SynI or K269Q-SynI and lysed at 14 DIV. Top, Cell extracts were analyzed by SDS-PAGE, transferred to nitrocellulose membranes and developed by immunoblotting with anti-SynI antibodies. An immunoblot from a representative experiment is shown. Tubulin immunoreactivity was used to control equal loading. Quantification of the SynI immunoreactivity was performed by densitometric analysis of the fluorograms and is shown as mean ± SEM of n = 3 independent experiments in the bottom. B, Basal and activity-dependent phosphorylation of WT-hSynI and K269Q-SynI in SynI KO hippocampal neurons. Neurons, transduced as in A, were solubilized in SDS with phosphatase inhibitors under either basal conditions or immediately after electrical field stimulation at 10 Hz for 30 s. Left, Samples were analyzed by immunoblotting for the level of total and site-specific phosphorylated SynI (1P-SynI: PKA site 1; 3P-SynI: CaMKII site 3; 4,5P-SynI: MAPK/ERK sites 4,5; 7P-SynI: Cdk5 site 7). Tubulin immunoreactivity was used as control for equal loading. Right, Immunoreactivity for phosphorylated and total SynI was quantified by densitometric analysis of the fluorograms. Site-specific phosphorylation of SynI, expressed as the ratio between the phospho-specific immunoreactivity and the total SynI immunoreactivity, is shown as mean ± SEM of n = 3 independent experiments. No significant changes in the phosphorylation state of K269Q-SynI at all phospho-sites were observed with respect to WT-SynI both under basal conditions and in response to electrical stimulation; *p < 0.05; **p < 0.01, one-way ANOVA followed by the Bonferroni's multiple-comparison test versus the respective control. C, Expression of mCherry-labeled WT- or K269Q-SynI and their distribution in excitatory and inhibitory terminals labeled with vGLUT1 and vGAT antibodies, respectively (left). In the bar graphs on the right, the quantification of the density of vGLUT and vGAT-positive puncta is shown as means ± SEM (n = 6 and 19 for WT- and K269Q-SynI, respectively). Scale bar, 20 μm. D, Left, Representative transmission electron micrographs of inhibitory presynaptic terminals from SynI KO neurons expressing an empty vector (SynI KO), WT-SynI or K269Q-SynI on which a pre-embedding immunogold localization of SynI was performed. Right, Gold particle distance from AZ was decreased in the K269Q-SynI expressing synapse, suggesting a mislocalization of mutant-SynI toward the AZ, as shown in the bar plot and in the XY SynI distribution plot. Data are shown as means ± SEM; **p < 0.01 unpaired Student's t test (the number of independent coverslips analyzed was 18 and 39 for WT-SynI and K269Q-SynI, respectively). Scale bar, 200 nm.

