Figure 3.

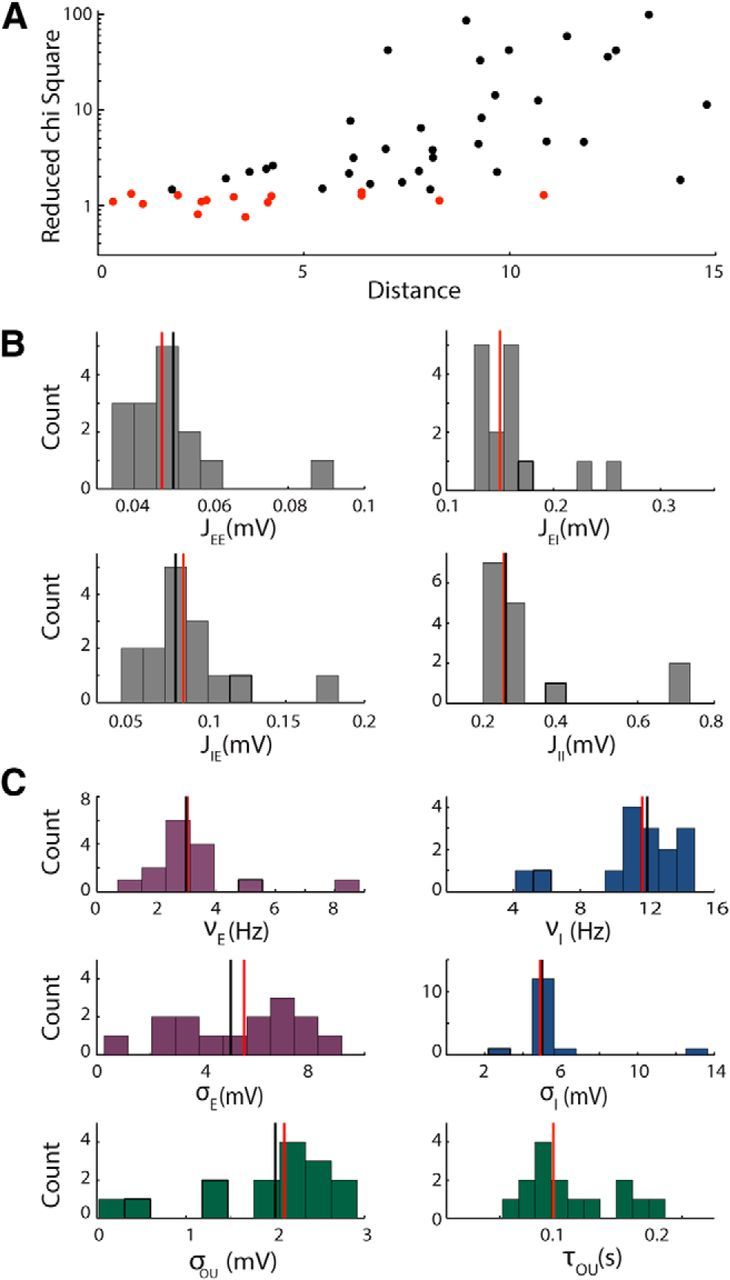
Test of the algorithm on synthetic data with free synaptic efficacies. A, Reduced χ2 values versus Euclidean distance from the real parameter set obtained running the fitting algorithm starting from 50 different initial conditions. The red points correspond to χ2 values with p < 0.05 and the black points to p > 0.05. The parameter set is composed by 10 parameters (νE, νI, σE, σI, σOU, τOU, JEE, JEI, JIE, JII). B, Distribution of the parameters describing the synaptic efficacies obtained by keeping only the cases in which the χ2 had p < 0.05 (red points in A). Vertical lines denote median of the distribution (red) and true values of the parameters (black). C, Distributions of the parameters that depend on the input variations obtained by keeping only the cases in which the χ2 had p < 0.05. Vertical lines are as in B. In both B and C, the distributions are broad, but the median values approximate well the values used to generate the data.
