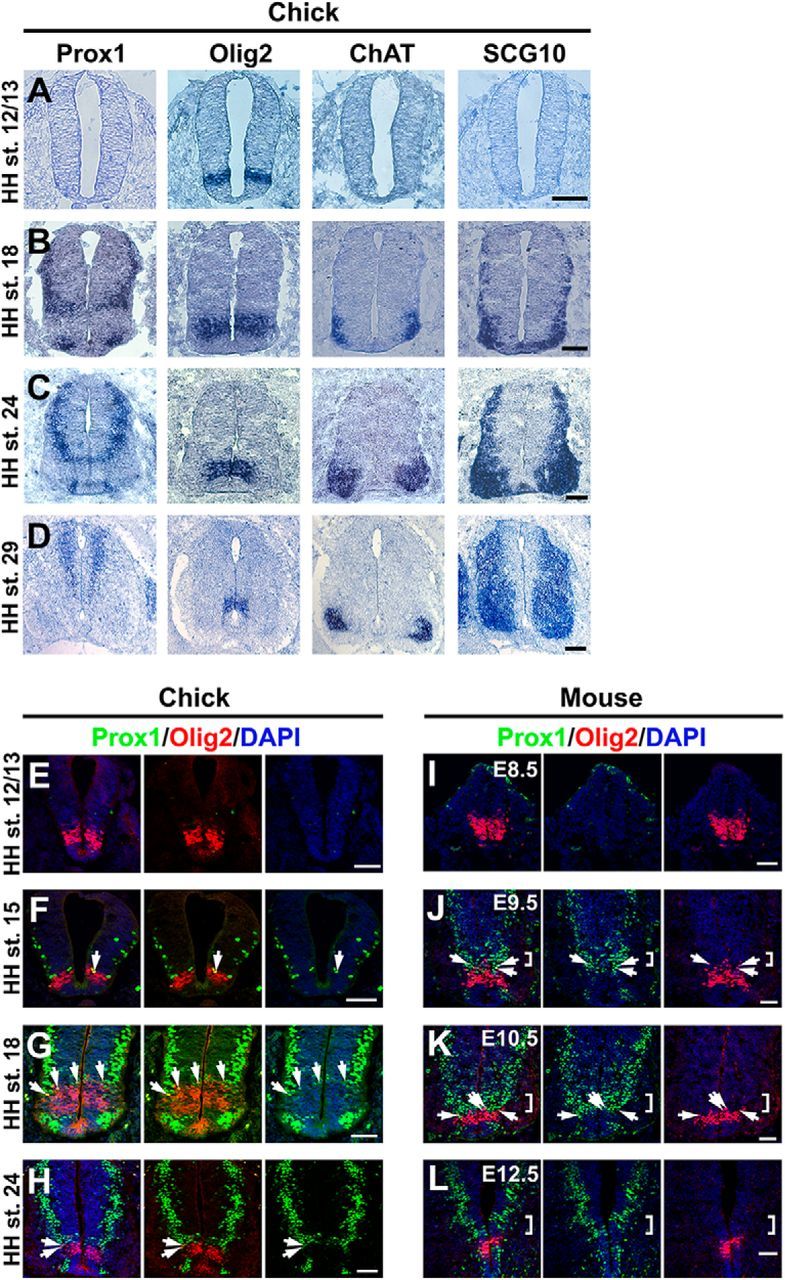
Figure 1.

Spatiotemporal expression patterns of Prox1 and Olig2 in chick and mouse neural tube. A–D, In situ hybridizations with Prox1 and comparison with Olig2, ChAT, and SCG10 on adjacent cryosections from HH stages 12/13 (A), 18 (B), 24 (C), and 29 (D) chick spinal cord. E–H, Double immunostainings of Prox1 (green) and Olig2 (red) in HH stage 12/13 (E), HH stage 15 (F), HH stage 18 (G), and HH stage 24 (H) chick spinal cord. The arrows indicate cells that coexpress Prox1 and Olig2. I–L, Double immunostainings of Prox1 (green) and Olig2 (red) in E8.5 (I), E9.5 (J), E10.5 (K), and E12.5 (L) mouse spinal cord. The square brackets indicate the Prox1+ cells, exactly above the Olig2+ cells in the p2 domain. The arrows indicate cells that coexpress Prox1 and Olig2. Scale bars: A–C, 50 μm; D, 100 μm; E–L, 50 μm.
