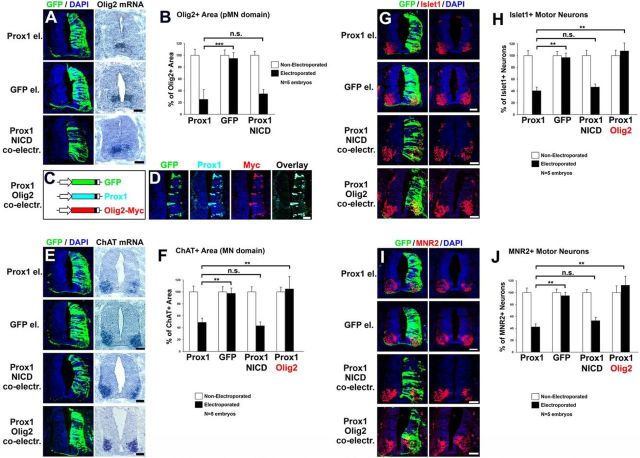
Figure 6.
Prox1 is sufficient for the suppression of Olig2 gene expression and inhibition of MN generation in vivo. A, GFP/DAPI staining and in situ hybridization for Olig2 in consecutive sections 48 h a.e. with Prox1/GFP, GFP alone, or Prox1/GFP and NICD. B, Quantitative analysis of the Olig2+ area using ImageJ software. The data are presented as percentage of the nonelectroporated side of the spinal cord. For Prox1 versus GFP alone: ***p < 0.001 (t test), n = 5; for Prox1 versus Prox1+ NICD: n.s. p > 0.05 (t test), n = 5. All cases referred to the electroporated side. C, Schematic representation of the GFP, Prox1, and Olig2 expression vectors. Note that Olig2 is tagged with Myc epitope and thus can be detected with anti-Myc immunostaining. D, Triple immunofluorescence analysis on spinal cord section with GFP, Prox1, and Myc 48 h a.e. with Prox1/GFP/Olig2, as indicated. E, GFP/DAPI staining and in situ hybridization for ChAT in consecutive sections 48 h a.e. with Prox1/GFP, GFP alone, Prox1/GFP and NICD, or Prox1/GFP and Olig2. F, Quantitative analysis of the ChAT+ area using ImageJ software. These data are presented as percentage of the nonelectroporated side of the spinal cord. For Prox1 versus GFP alone: **p < 0.01 (t test), n = 5; for Prox1 versus Prox1 + NICD: n.s. p > 0.05 (t test), n = 5; for Prox1 versus Prox1 + Olig2: **p < 0.01 (t test), n = 5. All cases referred to the electroporated side. G, Double GFP/Islet1 immunostainings in cryosections 48 h a.e. with Prox1/GFP, GFP alone, Prox1/GFP and NICD, or Prox1/GFP and Olig2. H, Quantitative analysis of the number of Ιslet1+ MNs. These data are presented as percentage of cells of the nonelectroporated side of spinal cord. For Prox1 versus GFP: **p < 0.01 (t test), n = 5; for Prox1 versus Prox1 + NICD: n.s. p > 0.05 (t test), n = 5; for Prox1 versus Prox1 + Olig2: **p < 0.01 (t test), n = 5. All cases referred to the electroporated side. I, Double GFP/MNR2 immunostainings in cryosections 48 h a.e. with Prox1/GFP, GFP alone, Prox1/GFP and NICD, or Prox1/GFP and Olig2. J, Quantitative analysis of the number of MNR2+ MNs. These data are presented as percentage of cells of the nonelectroporated side of the spinal cord. For Prox1 versus GFP: **p < 0.01 (t test), n = 5; for Prox1 versus Prox1 + NICD: n.s. p > 0.05 (t test), n = 5; for Prox1 versus Prox1 + Olig2: **p < 0.01 (t test), n = 5. All cases referred to the electroporated side. Scale bars: 50 μm.

