Figure 7.

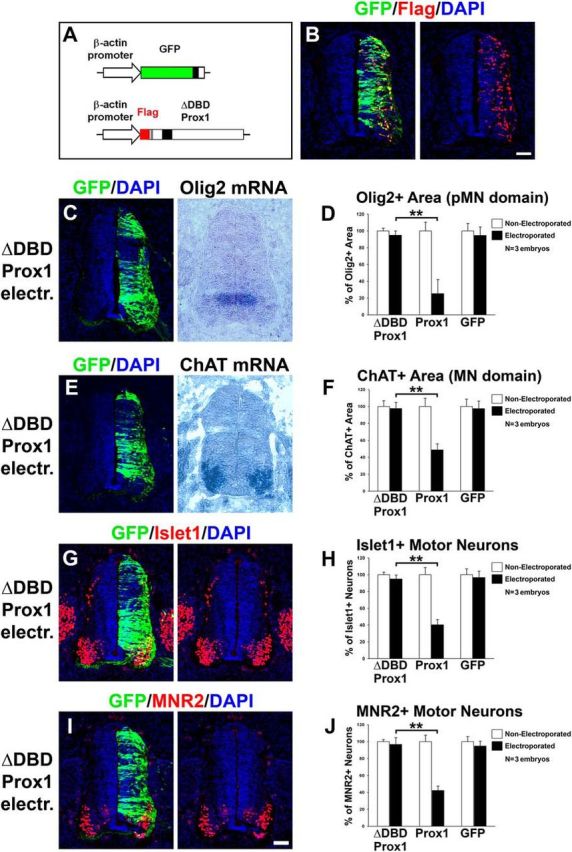
DBD domain of Prox1 is required in vivo for the Prox1-mediated effect on inhibiting Olig2 expression and MN generation. A, Schematic representation of the ΔDBD-Prox1 expression vector. Note that ΔDBD-Prox1 is tagged with Flag epitope and thus can be detected with anti-Flag immunostaining. B, Double immunofluorescence analysis on spinal cord section with GFP and Flag 48 h a.e. with ΔDBD-Prox1/GFP, as indicated. C, GFP/DAPI staining and in situ hybridization for Olig2 mRNA in consecutive sections 48 h a.e. with ΔDBD-Prox1. D, Quantitative analysis of the Olig2+ area. These data are presented as percentage of the nonelectroporated side of the spinal cord. The data for Prox1 and GFP electroporations are as in Figure 6B, and presented here for comparison. For ΔDBD-Prox1 versus Prox1, **p < 0.01 (t test), n = 3 embryos. All cases referred to the electroporated side. E, GFP/DAPI staining and in situ hybridization for ChAT mRNA in consecutive sections 48 h a.e. with ΔDBD-Prox1. F, Quantitative analysis of the ChAT+ area. These data are presented as percentage of the nonelectroporated side of the spinal cord. The data for Prox1 and GFP electroporations are as in Figure 6F, and presented here for comparison. For ΔDBD-Prox1 versus Prox1, **p < 0.01 (t test), n = 3 embryos. All cases referred to the electroporated side. G–J, Double immunostainings for GFP/Islet1 (G) and GFP/MNR2 (I) 48 h a.e. with ΔDBD-Prox1. H, J, Quantitative analysis of the number of Islet1+ MNs (H) and MNR2+ MNs (J). These data are presented as percentage of the nonelectroporated side. The data for Prox1 and GFP electroporations are as in Figure 6, H and J, respectively, and presented here for comparison. For Islet1+: ΔDBD-Prox1 versus Prox1, **p < 0.01 (t test), n = 3 embryos; for MNR2+: ΔDBD-Prox1 versus Prox1, **p < 0.01 (t test), n = 3 embryos. All cases referred to the electroporated side. Scale bars: 50 μm.
