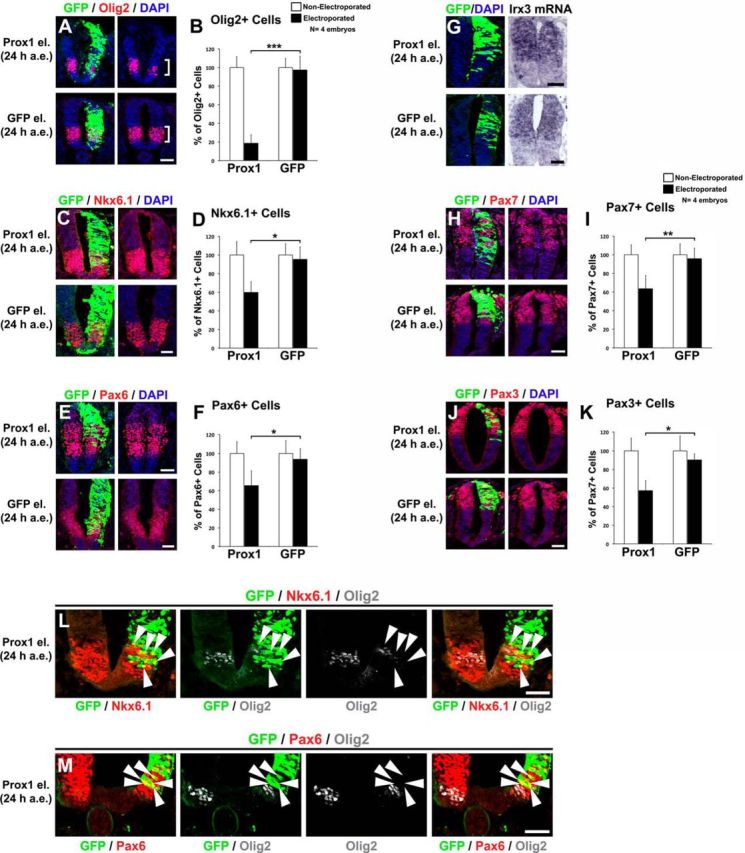
Figure 8.

Comparison of Prox1-mediated effect on Olig2 expression with that on other markers for neural progenitors, including Nkx6.1, Pax6, Irx3, Pax7, and Pax3. A, Double GFP/Olig2 immunostainings in cryosections 24 h a.e. with Prox1/GFP (top) or GFP alone (bottom). The square brackets indicate the pMN domain. Note the strong reduction of Olig2+ cells in the pMN domain. B, Quantitative analysis of the number of Olig2+ MNs. These data are presented as percentage of cells of the nonelectroporated side of the spinal cord. For Prox1 versus GFP, ***p < 0.001 (t test), n = 4. All cases referred to the electroporated side. C, Double GFP/Nkx6.1 immunostainings in cryosections 24 h a.e. with Prox1/GFP (top) or GFP alone (bottom). D, Quantitative analysis of the number of Nkx6.1+ cells. These data are presented as percentage of cells of the nonelectroporated side of the spinal cord. For Prox1 versus GFP, *p < 0.05 (t test), n = 4. All cases referred to the electroporated side. E, Double GFP/Pax6 immunostainings in cryosections 24 h a.e. with Prox1/GFP (top) or GFP alone (bottom). F, Quantitative analysis of the number of Pax6+ cells. These data are presented as percentage of cells of the nonelectroporated side of the spinal cord. For Prox1 versus GFP, *p < 0.05 (t test), n = 4. All cases referred to the electroporated side. G, GFP/DAPI staining and in situ hybridization for Irx3 in consecutive sections 24 h a.e. with Prox1/GFP (top) or GFP alone (bottom). H, Double GFP/Pax7 immunostainings in cryosections 24 h a.e. with Prox1/GFP (top) or GFP alone (bottom). I, Quantitative analysis of the number of Pax7+ cells. These data are presented as percentage of cells of the nonelectroporated side of the spinal cord. For Prox1 versus GFP, **p < 0.01 (t test), n = 4. All cases referred to the electroporated side. J, Double GFP/Pax3 immunostainings in cryosections 24 h a.e. with Prox1/GFP (top) or GFP alone (bottom). K, Quantitative analysis of the number of Pax3+ cells. These data are presented as percentage of cells of the nonelectroporated side of the spinal cord. For Prox1 versus GFP, *p < 0.05 (t test), n = 4. All cases referred to the electroporated side. L, Triple immunostaining of GFP (green), Nkx6.1 (red), and Olig2 (gray; artificially pseudocolored after confocal analysis) in cryosection 24 h a.e. with Prox1/GFP. The arrowheads indicate the GFP+, Nkx6.1+, and Olig2− cells into the Nkx6.1 expression domain. Note the strong reduction in the Olig2 expression. M, Triple immunostaining of GFP (green), Pax6 (red), and Olig2 (gray; artificially pseudocolored after confocal analysis) in cryosection 24 h a.e. with Prox1/GFP. The arrowheads indicate the GFP+, Pax6+, and Olig2− cells into the Pax6 expression domain. Scale bars: 50 μm.
