Figure 9.

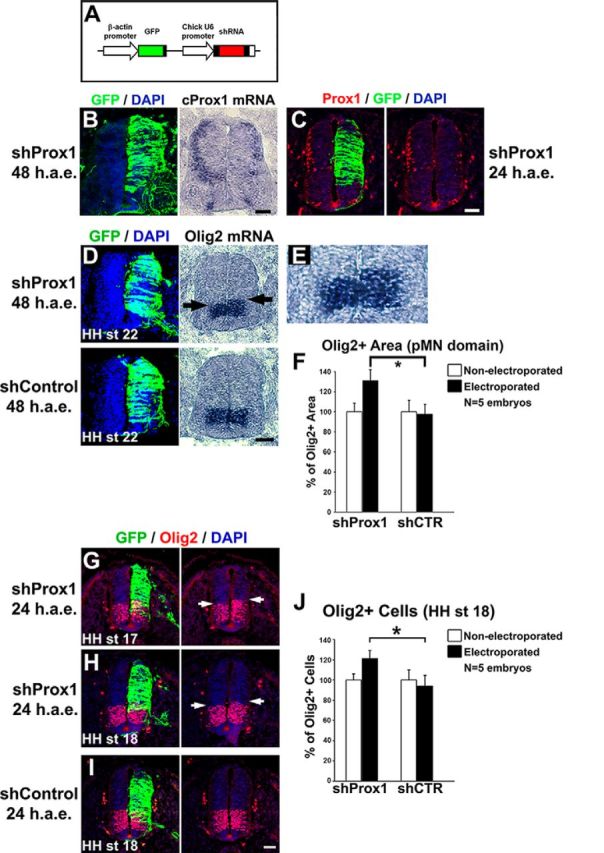
Prox1 is necessary for the suppression of Olig2 gene expression in vivo. A, Schematic representation of the shRNA-based constructs used in this study. GFP under the control of chick β-actin promoter was also included to follow expression of the shRNA. B, GFP/DAPI staining and in situ hybridization for cProx1 gene in consecutive sections 48 h a.e. with shProx1. C, Double GFP/Prox1 immunostaining 24 h a.e. with shProx1. D, GFP/DAPI staining and in situ hybridization for Olig2 in consecutive sections 48 h a.e. with shProx1 or shControl. Arrows in the micrograph indicate the dorsal expansion of Olig2 expression area toward the p2 domain compared with nonelectroporated side. E, The micrograph in B is a larger magnification of the Olig2 expression domain in D. F, Quantitative analysis of the Olig2+ area using ImageJ software. These data are presented as percentage of the nonelectroporated side of the spinal cord. For shProx1 versus shControl, *p < 0.05 (t test), n = 5 embryos. All cases referred to the electroporated side. G–I, Double GFP/Olig2 immunostainings in cryosections 24 h a.e. with shProx1 (G, H) or shControl (I) and analysis at HH stage 17 (G) or HH stage 18 (H, I). Arrows in the micrograph indicate the dorsal expansion of Olig2 expression area toward the p2 domain compared with nonelectroporated side. J, Quantitative analysis of the number of Olig2+ progenitor cells. These data are presented as percentage of cells of the nonelectroporated side of the spinal cord. For shProx1 versus shControl, *p < 0.05 (t test), n = 5 embryos. All cases referred to the electroporated side. Scale bars: A: 50 μm.
