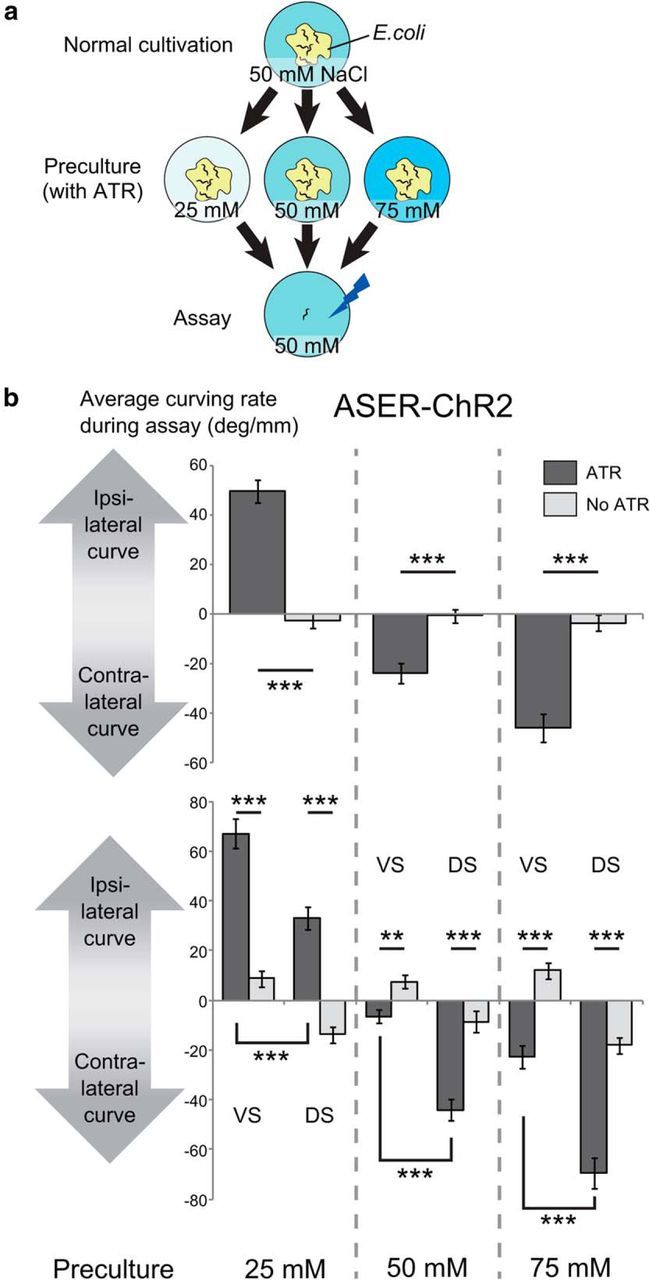
Figure 2.

Bidirectional klinotaxis-like curving induced by ASER activation. a, Culture and assay conditions. L4 animals were transferred to the preculture plates that contained ATR necessary for channelrhodopsin to work in C. elegans and different concentrations of NaCl (25, 50, or 75 mm), and were tested on the next day on the assay plate that contained 50 mm NaCl. b, Curving induced by phasic activation of the ASER neuron after preculture at different concentrations of NaCl. Average curving rate of each animal during the 10 min test period was calculated and the values were averaged across animals that moved forward for ≥10 mm during the 10 min period. In this assay, we recorded whether the side of stimulation was the ventral side or the dorsal side of each animal. “No ATR” indicates the results of the animals precultured without ATR. JN1601 strain was used. Top, Average curving rate during the 10 min calculated without considering ventral/dorsal difference. The numbers of animals for each bar from left to right were 40, 40, 37, 40, 32, and 39. The effect of concentration of preculture on curving bias was significant (F(2,222) = 80.3, p < 2 × 10⁻¹⁶) and the effect of interaction between presence of ATR and concentration of preculture was significant (F(2,222) = 85.6, p < 2 × 10⁻¹⁶, 2-way ANOVA). p values of the statistical test between “ATR” and “no ATR” in each preculture condition were p = 4.55 × 10⁻¹⁵, p = 6.02 × 10⁻⁶, and p = 2.92 × 10⁻⁹ (***p < 0.001, Student's t test). Bottom, Average curving rate in response to ventral stimuli and dorsal stimuli, calculated by the same dataset as the top panel. VS, Ventral stimuli; DS, dorsal stimuli. The numbers of animals for each bar were 20, 20, 20, 20, 20, 20, 17, 20, 16, 19, 16, and 20. The main effects or interactions of three factors [presence of ATR while precultivation (ATR), concentration of preculture (concentration), dorsal/ventral difference of stimulation (D/V)] on curving bias were tested by three-way ANOVA: the effect of concentration was significant (F(2,216) = 146, p < 2.2 × 10⁻¹⁶); the effect of D/V was significant (F(1,216) = 165, p < 2.2 × 10⁻¹⁶); the effect of interaction between concentration and D/V was not significant (F(2,216) = 2.31, p = 0.102); the effect of interaction between concentration and ATR was significant (F(2,216) = 158, p < 2.2 × 10⁻¹⁶); and the effect of interaction between D/V and ATR was significant (F(1,216) = 11.8, p = 7.25 × 10⁻⁴). Corrected p values (kp): VS(ATR) versus VS(No ATR), 3.00 × 10⁻¹⁰, 1.87 × 10⁻⁹, 4.16 × 10⁻⁴ (25 mm preculture condition); DS(ATR) versus DS(No ATR), 1.35 × 10⁻³, 4.54 × 10⁻⁶, 1.94 × 10⁻⁸ (50 mm preculture condition); VS(ATR) versus DS(ATR), 9.66 × 10⁻⁷, 1.01 × 10⁻⁸, 1.87 × 10⁻⁹ (75 mm preculture condition); k = 3; ***kp < 0.001, **kp < 0.01, *kp < 0.05, t test with Bonferroni's correction.
